
Chatbot analytics helps you measure how well your chatbot is performing by analyzing user interactions, technical efficiency, and customer satisfaction. Tracking these metrics can improve user experience, reduce costs, and boost ROI. Here’s a quick overview of the key metrics:
- Usage Metrics: Total users, active users, new users, total conversations, and bounce rates.
- Engagement Metrics: Average conversation length, messages per conversation, engaged users, and retention rates.
- Performance Metrics: Response time, goal completion rate (GCR), fallback rate, containment rate, and human handoff rate.
- Satisfaction Metrics: Customer Satisfaction Score (CSAT), Net Promoter Score (NPS), sentiment analysis, and task success rate.
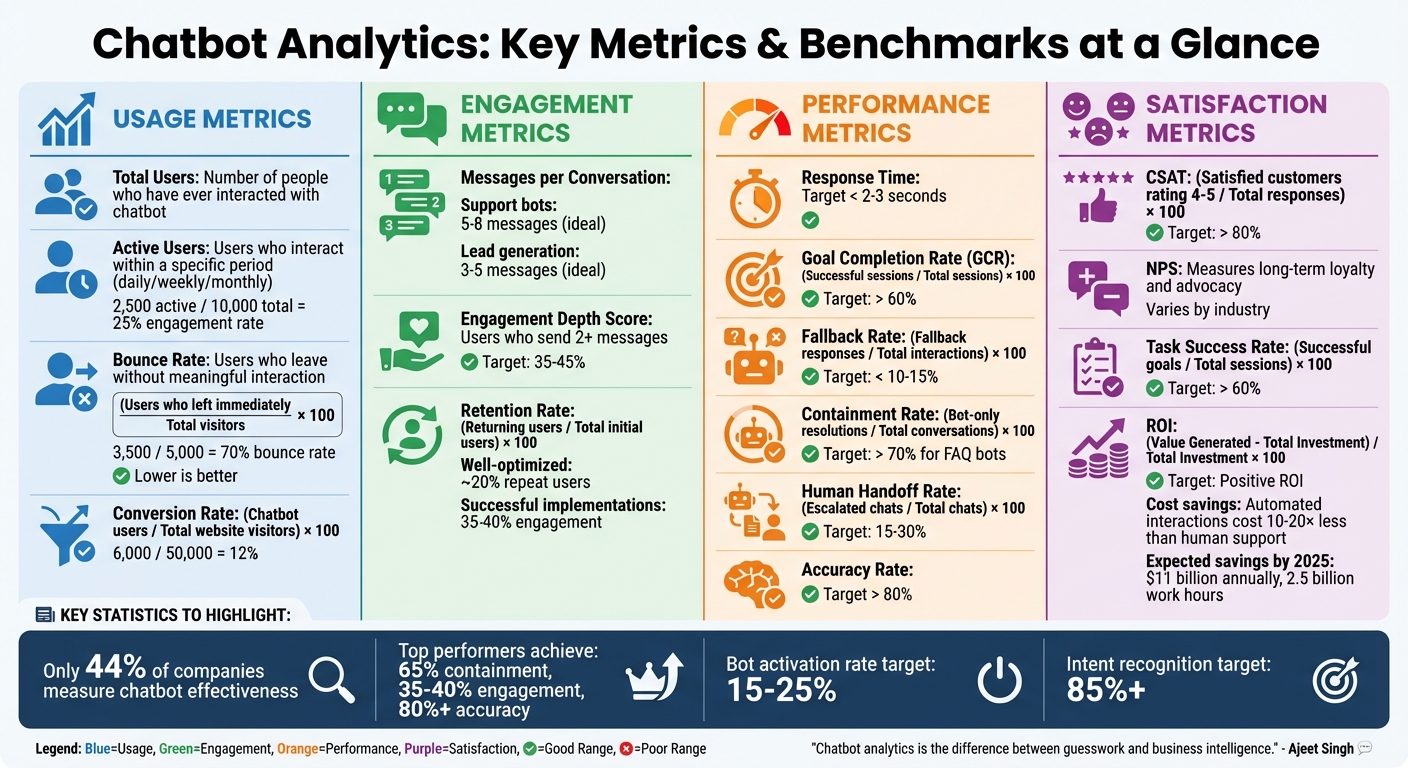
Chatbot Analytics Key Metrics and Benchmarks Guide
How To Measure Chatbot Performance Effectively?
Usage Metrics
Usage metrics form the backbone of understanding how well your chatbot is performing in terms of reach and adoption. These tools are often powered by conversational AI to simulate human-like interactions. These metrics help you identify who is engaging with your bot, how frequently they interact, and whether they return after their first conversation. Without these insights, it’s almost impossible to track growth or pinpoint visibility challenges.
Total Users and Active Users
The term "total users" refers to the number of people who have ever interacted with your chatbot [1]. This number acts as a baseline for gauging your chatbot's overall reach and its impact on your audience [7]. But focusing only on total users won’t give you the complete picture - you also need to monitor active users.
Active users are those who interact with your bot within a specific period, such as daily, weekly, or monthly [1]. As OvationCXM highlights, tracking active users is essential for assessing a chatbot's success: "This KPI allows you to get a feel for the overall popularity of your chatbot and is a good barometer of its success" [8].
For example, if you have 2,500 active users out of 10,000 total users, your engagement rate is 25% [1]. If this percentage declines, it might be time to rethink your chatbot’s design or use cases. Additionally, you can calculate your chatbot’s conversion rate by dividing the number of chatbot users by the total website visitors and multiplying by 100. For instance, if 6,000 chatbot users come from 50,000 website visitors, the conversion rate is 12% [1].
Once you’ve measured active and total users, it’s time to look at new interactions to evaluate how well your marketing efforts are driving traffic.
New Users and Total Conversations
"New users" refers to first-time visitors who interact with your chatbot during a specific timeframe [1]. This metric is a key indicator of how effective your marketing campaigns are at bringing people to your chatbot.
Meanwhile, total conversations track the number of interactions initiated with your bot, offering insights into engagement trends [3]. For example, a spike in conversations during a holiday sale or product launch shows increased user activity. On the other hand, low conversation numbers might mean your chatbot is hard to find or isn’t placed where users need it most. In such cases, consider moving your chatbot widget to high-traffic areas like product pages or FAQs [3].
After reviewing user activity and engagement levels, it’s important to understand how well your bot captures initial interest by looking at the bounce rate.
Bounce Rate
The bounce rate measures the percentage of users who open your chatbot but leave without meaningful interaction [1]. For instance, if 5,000 users visit your chatbot and 3,500 leave immediately, the bounce rate is 70% [1]. A high bounce rate is a clear warning sign.
Common causes of a high bounce rate include an unappealing welcome message, poor widget placement, or slow response times [1] [7]. BotsCrew explains, "If this conversion rate is very low, it may mean that the chatbot looks unattractive, your welcome message looks unengaging, or simply users don’t notice your bot because of the website or widget design" [1].
To fix this, experiment with different welcome messages that align better with user expectations, make sure your widget is clearly visible, and ensure fast response times to prevent frustration [5] [6]. A lower bounce rate suggests your chatbot is effectively grabbing attention and guiding users toward their goals.
Engagement Metrics
Once you've assessed overall user activity, engagement metrics help you understand how well your chatbot is holding users' attention. While usage metrics highlight who is visiting, engagement metrics dive deeper into the quality of those interactions. These insights can reveal whether users are simply passing through or genuinely connecting with your chatbot. Let’s explore specific metrics that measure interaction depth and user loyalty.
Average Conversation Length and Messages per Conversation
The average conversation length tracks how many messages are exchanged between a user’s first message and their last reply [1]. Longer conversations often suggest meaningful engagement, but the ideal length depends on the chatbot’s purpose. For instance, a support bot designed to resolve issues quickly may have shorter conversations, while a lead generation bot typically requires more back-and-forth to qualify prospects.
Another key measure is the message exchange rate, calculated by dividing the total number of messages by the number of conversations [10]. For support bots, an ideal range is 5–8 messages per conversation, while lead generation bots generally aim for 3–5 [10]. If your bot falls outside these ranges, it’s worth investigating. Too few messages might indicate users are losing interest early on, while too many could signal confusion - perhaps the bot isn’t understanding user requests or providing clear answers.
The engagement depth score adds another layer by measuring the percentage of users who send two or more messages [10]. This metric gauges whether your bot’s initial responses are compelling enough to encourage further interaction. A healthy target falls between 35–45% [10]. If your numbers are low, revisit your opening messages to ensure they directly address user needs rather than relying on generic replies.
Engaged Users and Retention Rate
While active users might simply read a chatbot’s message, engaged users take it a step further by replying - offering a more accurate measure of interaction [7]. These users represent genuine participation and are a key indicator of your chatbot’s effectiveness.
The retention rate measures the percentage of users who return for subsequent interactions. This is calculated by dividing the number of returning users by the total initial users, then multiplying by 100 [9] [5]. Unlike one-time interactions, retention reflects your bot’s ability to deliver ongoing value and foster long-term relationships. High retention rates often signal customer loyalty, trust in your brand, and overall satisfaction [9] [5]. Typically, well-optimized chatbots achieve a repeat user rate of about 20%, with successful implementations reaching engagement rates around 35–40% [4].
A low retention rate can point to shortcomings like limited functionality, unresolved issues during the first interaction, or a lack of compelling reasons to return [9]. To address this, consider personalizing the experience for returning users. Use customer data - such as purchase history or previous inquiries - to offer tailored recommendations or greetings [4]. Proactive communication can also help; for example, your bot could send reminders, notifications, or updates about deals that align with a user’s past behavior [4].
In late 2023, Italian eyewear retailer Eye-oo made a significant shift by replacing Shopify Chat with advanced AI chat flows. These new flows prioritized cart recovery and personalized recommendations. Over the course of a year, the company reported a $238,000 revenue boost directly linked to the chatbot and saw a 25% overall sales increase. The bot instantly resolved 82% of 2,233 support inquiries and reduced first-response times from several minutes to just 30 seconds [10].
To maintain engagement and accuracy, regularly update your chatbot’s training data based on user feedback [6]. If conversations are dragging on, simplify decision trees to provide quicker resolutions [5]. For AI-powered bots, aim for an accuracy rate of 80% or higher to ensure users find enough value to return [1].
Performance and Efficiency Metrics
Performance and efficiency metrics are the backbone of understanding how well your chatbot is doing. They give you clear insights into areas where your bot shines and where it needs improvement, helping you fine-tune its performance.
Response Time
Response time measures how quickly your chatbot replies, calculated by dividing the total response time by the number of responses [5][9]. This is a critical factor for both operational efficiency and user satisfaction [9].
Fast responses are non-negotiable - aim to keep them under 2–3 seconds [11]. For instance, in e-commerce, a bot that replies within 2 seconds is far more likely to keep users engaged compared to one with a 5-second delay [6]. Delays can frustrate users, leading to higher bounce rates and abandoned sessions [5][6].
However, several issues, like complex queries, slow AI processing, or integration delays, can slow down your bot [11]. To maintain speed, consider these strategies:
- Use faster AI processing engines.
- Simplify conversation flows to reduce data retrieval time.
- Monitor your servers and APIs for performance issues [11][6].
Leverage your analytics tools to pinpoint "bottleneck" queries that take longer than average to resolve, and address them directly [5][11].
Goal Completion Rate and Fallback Rate
Goal completion rate (GCR) tracks how often users achieve their intended outcomes, such as completing a purchase or finding the information they need. A GCR of 60% or higher is a good target [10]. A low rate indicates problems like confusing workflows or frustrating user experiences that cause people to abandon the conversation.
Fallback rate, on the other hand, measures how often your bot resorts to "I don't understand" responses [5][7]. This metric highlights gaps in your bot's knowledge base or Natural Language Processing (NLP) capabilities. To keep users confident in your bot, aim for an accuracy rate of 80% or higher [1]. When accuracy dips below this threshold, users quickly lose trust in the bot's ability to assist them.
"Accuracy is the baseline requirement of your AI-powered chatbot. Without it, hopes of reducing customer friction and accelerating revenue aren't realistic." - Mark Kilens, VP of Content and Community, Drift [1]
To improve these metrics:
- Regularly review user inputs that trigger fallback responses and update your bot's training library with missing intents [1][5].
- If your GCR is low, analyze where users drop off and simplify the steps needed to reach their goal [6][5].
- Conduct A/B testing to compare different conversation scripts and identify which paths yield higher completion rates [6].
Next, let’s look at how well your chatbot handles tasks independently.
Self-Service Rate and Containment Rate
Measuring your chatbot's independence is just as important as tracking speed and goal achievement. Containment rate reflects the percentage of interactions your bot resolves without needing human intervention [10]. This is also known as the self-service rate or automation rate [5]. For FAQ-based bots, a containment rate of 70% or higher is a strong benchmark [10].
The financial benefits are clear: automated interactions cost 10–20 times less than those requiring human support, potentially reducing operational costs by up to 30% [10]. By 2025, chatbots are expected to save businesses around 2.5 billion work hours [10].
The human handoff rate (or takeover rate) is the flip side of containment. Ideally, this should fall between 15% and 30%. Higher rates suggest your bot struggles with basic queries [10]. To address this:
- Identify the most common questions leading to human escalation and prioritize them for AI training [2].
- Examine conversation flows to see if users are encountering roadblocks or if the bot lacks necessary integrations to complete tasks [1][10].
| Metric | Formula | Target Benchmark |
|---|---|---|
| Containment Rate | (Bot-only Resolutions / Total Conversations) × 100 | > 70% (for FAQs) [10] |
| Goal Completion Rate | (Successful Sessions / Total Sessions) × 100 | > 60% [10] |
| Fallback Rate | (Fallback Responses / Total User Interactions) × 100 | < 10–15% [1][10] |
| Human Handoff Rate | (Escalated Chats / Total Chats) × 100 | 15%–30% [10] |
Together, these metrics paint a clear picture of your chatbot's efficiency, independence, and cost-saving potential, making them essential for assessing its overall value to your business.
Satisfaction and Outcome Metrics
Beyond measuring performance, satisfaction and outcome metrics reveal the true value your chatbot delivers. These metrics are directly tied to customer trust, loyalty, and, ultimately, your business's financial success. Let’s break down how these satisfaction indicators translate into actionable insights and financial results.
Customer Satisfaction Score (CSAT) and Net Promoter Score (NPS)
CSAT gauges immediate customer satisfaction with a simple question: “How satisfied were you with the service?” Users respond on a 1-to-5 scale, where 1 means "Very unsatisfied" and 5 means "Very satisfied" [12]. To calculate CSAT, divide the number of satisfied customers (those who rated 4 or 5) by the total number of survey responses, then multiply by 100 [12]. For chatbots, a CSAT score of 80% or higher is generally considered strong [10].
NPS, on the other hand, measures long-term loyalty. It asks: “How likely are you to recommend [Company/Product] to a friend or colleague?” This metric provides a broader view of customer trust and willingness to advocate for your brand.
Timing is critical. Collect CSAT feedback immediately after interactions via pop-ups to capture fresh impressions. To avoid survey fatigue, limit surveys to key moments - such as after a successful purchase or a resolved support ticket. Pairing numerical scores with open-ended feedback can also uncover the reasons behind the ratings, offering deeper insights.
For example, a telecom study involving 35,000 chatbot interactions found that 66% of users rated their experience as 1 out of 5 [5]. Monitoring these metrics helps identify and address poor performance quickly.
User Sentiment Analysis
Sentiment analysis goes beyond explicit feedback by evaluating the emotional tone of user messages - whether positive, negative, or neutral - using Natural Language Processing (NLP) [5]. Unlike CSAT, which relies on user input, sentiment analysis works in real time by analyzing keywords, emojis, and contextual cues [5].
This tool is especially useful for spotting mood shifts, allowing for timely human intervention to prevent chat abandonment [10]. By tracking sentiment trends, you can identify recurring pain points where users feel stuck or dissatisfied, enabling targeted improvements [10].
When combined with performance data, sentiment analysis provides a more comprehensive view of customer trust and loyalty than completion rates alone [5].
Task Success Rate and ROI
Task success rate (or Goal Completion Rate, GCR) measures the percentage of users who achieve a specific objective, like booking a meeting, resolving a ticket, or completing a purchase [5][10]. To calculate it, divide the number of successful goals by the total sessions, then multiply by 100. A GCR of 60% or higher is often seen as effective [10].
ROI is calculated using the formula:
(Value Generated – Total Investment) / Total Investment × 100 [10].
Value generated includes cost savings and additional revenue. For example, cost savings can be estimated as the difference between human chat costs and bot costs, multiplied by the number of bot-handled chats. Revenue might come from qualified leads, calculated as (Qualified leads × Conversion rate × Average deal size) [10].
By 2025, businesses are expected to save $11 billion annually and 2.5 billion work hours through chatbot implementation [10]. Automated interactions typically cost 10–20 times less than human-led support [10].
To maximize ROI, set specific goals - like reducing support calls by 20% - instead of vague objectives [5]. Tie every metric to a monetary value, such as average revenue per lead or the cost of an agent’s time, to measure the financial impact accurately [2]. Establish a baseline by monitoring performance for 2–4 weeks before making changes [2].
| Metric | Focus | Target Benchmark |
|---|---|---|
| CSAT | Immediate satisfaction with interactions | 80% or higher [10] |
| NPS | Long-term loyalty and advocacy | Varies by industry |
| Task Success Rate (GCR) | Percentage of users achieving defined goals | 60% or higher [10] |
| ROI | Financial return compared to investment | Positive ROI |
Using ChatSpark Analytics for Decision-Making
Gathering data is just the starting point - the real power lies in using that data to inform actions. ChatSpark's analytics dashboard simplifies this process by bringing together performance metrics from all your channels into one place. This unified view makes it easier to spot problems, fine-tune operations, and measure outcomes effectively. As mentioned earlier, having everything centralized is key to tracking performance in real time and driving continuous improvement.
Real-Time Insights Across Channels
ChatSpark pulls data from platforms like websites, WhatsApp, Slack, Facebook, Instagram, and Telegram into a single, user-friendly dashboard. This omnichannel approach eliminates the hassle of switching between platforms to assess how your chatbot is performing. Instead, you get a unified snapshot of key metrics such as response times, engagement rates, and fallback instances across all channels. This consolidated view builds on earlier discussions about performance tracking, enabling smarter, faster decision-making.
The platform uses AI to pinpoint recurring issues and trends that might slip through manual reviews [5]. For instance, if users frequently abandon chats at a specific point on WhatsApp but not on your website, the dashboard flags this inconsistency so you can investigate and adjust the flow. Real-time monitoring also catches spikes in errors or delays, prompting immediate action [5][4].
ChatSpark dives deeper by tracking interaction depth, measuring the average number of messages exchanged per chat. This helps you gauge whether users are actively engaging or dropping off too soon [13]. It also identifies "Key Queries" - the most common customer questions - so you can fine-tune responses and prioritize the information users value most [13].
Setting Benchmarks and Making Improvements
Once you’ve gathered real-time insights, the next step is to establish a baseline. Monitor your chatbot's performance for 2–4 weeks without making changes [2]. This gives you a reference point to assess the impact of future optimizations. ChatSpark's analytics make it easy to set measurable benchmarks, such as achieving a 15–25% bot activation rate, a 60%+ goal completion rate, and 85%+ intent recognition accuracy [10].
With A/B testing tools, you can experiment with different elements like welcome messages or conversation scripts, comparing click-through rates to determine which version works best [4]. The platform also evaluates "Learning Efficiency", measuring how effectively the chatbot uses its training data to adapt and improve over time [13]. Additionally, it highlights "What Resonates" - responses that users engage with the most - helping you refine and enhance your chatbot’s performance [13].
"Chatbot analytics is the difference between guesswork and business intelligence." - Ajeet Singh, Founder & CEO, Centripe [10]
ChatSpark goes a step further by estimating efficiency gains, quantifying the time saved through automation. This helps you demonstrate ROI and productivity improvements [13]. By linking metrics to financial outcomes - like labor costs saved through automated responses or revenue generated from bot-qualified leads - you can clearly measure the chatbot's monetary impact [2][3]. These insights make it easier to refine and scale your chatbot strategy for long-term success.
Conclusion
Chatbot analytics transforms raw data into actionable insights that can shape smarter business strategies. The metrics outlined in this guide - spanning usage, engagement, performance, efficiency, and satisfaction - offer a complete snapshot of how your conversational AI performs and where adjustments are needed. Without tracking these key indicators, you're essentially operating blind, missing the chance to identify bottlenecks, demonstrate ROI, or enhance the customer experience. These metrics lay the groundwork for spotting market trends and uncovering new opportunities.
Yet, only 44% of companies currently measure their chatbot's effectiveness[4]. This leaves a significant gap - and an opportunity. Businesses that embrace data-driven improvements often achieve containment rates around 65%, engagement rates between 35% and 40%, and accuracy scores exceeding 80%[2][4][1].
Tools like ChatSpark simplify this process by consolidating multi-channel data from platforms like websites, WhatsApp, Facebook, Instagram, Telegram, and Slack into a single, unified dashboard. This centralized view enables real-time monitoring of response times, engagement trends, and user sentiment across all channels. With AI-powered insights, ChatSpark automatically flags recurring issues, tracks interaction depth, and pinpoints key customer queries - allowing you to refine conversation flows and focus on what matters most to your audience.
The key to success lies in treating analytics as an ongoing feedback loop. Start by establishing a baseline over a 2–4 week period[2], then refine your messaging with A/B testing[4]. Pay close attention to fallback phrases and review them weekly to address technical errors quickly. Set measurable goals, like cutting support calls by 20% or achieving an 85% CSAT score, and tie these targets to financial outcomes, such as reduced labor costs or revenue generated from bot-qualified leads[5][2]. This iterative approach ensures continuous improvement.
Ultimately, collecting data is just the first step. The real value comes from acting on it. By leveraging an advanced analytics dashboard, businesses can make smarter decisions, improve customer satisfaction, and drive measurable growth.
FAQs
How do chatbot analytics help improve user engagement and retention?
Chatbot analytics offer a window into understanding user behavior by monitoring crucial metrics such as engagement rate, retention rate, conversation length, and drop-off points. These metrics reveal where users might lose interest or exit conversations.
With this data in hand, businesses can fine-tune chatbot workflows, sharpen response quality, and craft more tailored experiences. The result? Higher user engagement, more frequent interactions, and a noticeable boost in customer satisfaction and loyalty.
What are the key metrics to evaluate a chatbot's performance?
To measure how well a chatbot is performing, keep an eye on important metrics such as engagement rate, retention rate, average response time, average handling time, and resolution rate. These numbers reveal how effectively your chatbot communicates with users, solves their problems, and boosts overall customer satisfaction.
For instance, a strong engagement rate suggests that users find your chatbot helpful and engaging, while a low average response time indicates it’s providing fast support. By tracking these metrics consistently, you can pinpoint areas that need attention and make sure your chatbot is delivering the best possible experience.
How do satisfaction metrics like CSAT and NPS shape chatbot performance?
Metrics like CSAT (Customer Satisfaction Score) and NPS (Net Promoter Score) offer a clear window into how users feel about your chatbot. By digging into this feedback, you can uncover problem areas, refine conversation flows, and make sure your chatbot stays in sync with your business objectives.
These scores are key for deciding which updates will have the biggest impact on improving the user experience. Keeping an eye on them regularly helps ensure your chatbot consistently meets - and even exceeds - user expectations, strengthening customer connections along the way.