If I had to track only one thing, I’d track resolved outcomes, not bot activity. AI support can cost as little as $0.10 to $0.50 per resolved conversation, while human-handled cases often cost $5 to $15. But those savings fall apart if the bot replies fast, fails to fix the issue, and sends the customer back again.
Here’s the short version: I’d watch eight metrics as one group, not one by one. That means first response time, resolution time, containment rate, escalation rate, accuracy, CSAT, sentiment, and cost per resolution. I’d also split results by intent, language, and support path - like AI-only, human-only, AI-assisted, and AI-escalated - so weak spots don’t get buried in averages.
A few numbers show why this matters:
- 85% of CX leaders say customers may leave after an issue is not solved on the first contact
- 82% of consumers expect a reply within 10 minutes
- Median Tier 1 deflection is 41.2%, while top-quartile programs reach 58.7%
- A common containment target is 60% to 75%
- A common escalation range is 15% to 30%
- A solid CSAT baseline is 4.0+ out of 5
What I’d keep in mind:
- Fast replies are not enough
- High containment is not always a win
- Low escalations are not always good
- Cost per contact can hide bad support
- Language-level reporting matters if you serve more than one market
Quick comparison
| Metric | What it shows | What I’d check with it |
|---|---|---|
| First Response Time | How fast customers get a real reply | Resolution time, CSAT |
| Resolution Time | How long it takes to fix the issue | Intent, workflow gaps |
| Containment Rate | How often AI handles the case without a human | Repeats, CSAT, sentiment |
| Escalation Rate | How often AI sends cases to agents | Handoff rules, topic gaps |
| Accuracy | Whether answers are correct | Policy risk, QA reviews |
| CSAT | How customers rated the chat | Sample size, resolution data |
| Sentiment | How the conversation felt | Resolution, repeat contact |
| Cost per Resolution | What a solved case costs | ROI, success rate |
So my takeaway is simple: I’d judge AI support by whether it solves issues fast, correctly, and at lower cost - not by how many replies it sends.
Build a Balanced AI Support Metrics Framework
A good metrics framework ties every KPI to a business goal. That way, you’re not just collecting numbers. You’re tracking whether AI support is making service faster, cutting manual work, improving answer quality, or lowering costs.
This framework groups support metrics into four buckets: speed, automation, quality, and outcomes. Together, they cover first response time, resolution time, containment rate, CSAT, escalation rate, accuracy, and cost per resolution.
Match Metrics to Business Goals
Each metric should connect to something the business cares about. If the goal is faster service, look at first response time and resolution time. If the goal is fewer manual tickets, track containment and escalation rates. If the goal is better answers, focus on accuracy, CSAT, and sentiment. If the goal is lower costs, measure cost per resolution and ROI.
The table below shows how those categories line up with business goals:
| Metric Category | Core Business Goal | Key Metrics |
|---|---|---|
| Speed | Faster service delivery | First response time, resolution time |
| Automation | Fewer manual tickets | Containment rate, escalation rate |
| Quality | More accurate, helpful answers | Accuracy, CSAT, sentiment |
| Outcomes | Lower costs, stronger ROI | Cost per resolution, ROI |
There’s one more layer that matters: segmentation. Performance should be split by interaction type and intent, with separate benchmarks for simple and complex issues [1]. You should also measure AI-only, human-only, AI-assisted, and AI-escalated interactions on their own [1]. Otherwise, the numbers can blur together and hide what’s working.
Set Clear Definitions and Reliable Benchmarks
Loose definitions create messy reporting. Before tracking anything, get the whole team aligned on what each term means.
- Resolution: the customer completed the intended task.
- Escalation: the AI handed the case to a human.
- Repeat contact: the customer returned with the same issue within 24, 48, or 72 hours.
Benchmarks help you tell whether a metric is healthy, weak, or standout. Percentile reporting helps you see whether weak spots are happening across the board or only in a few cases [2]. Median enterprise Tier 1 deflection stands at 41.2%, while top-quartile deployments reach 58.7% [2].
Use ChatSpark as Your Reporting Layer
Weekly spreadsheet reporting eats up time fast. ChatSpark pulls support data from web, social, and messaging channels into one analytics layer, so your team doesn’t have to patch reports together by hand.
Its dashboards show trends in response time and resolution performance. Because reporting sits in one place, metric comparisons stay consistent across channels and languages. For teams serving customers in more than one language, ChatSpark tracks outcomes across 85+ languages, which helps keep quality visible across markets.
Once reporting is centralized, it becomes much easier to track speed, automation, and outcome metrics directly.
The Core AI Customer Support Metrics to Track
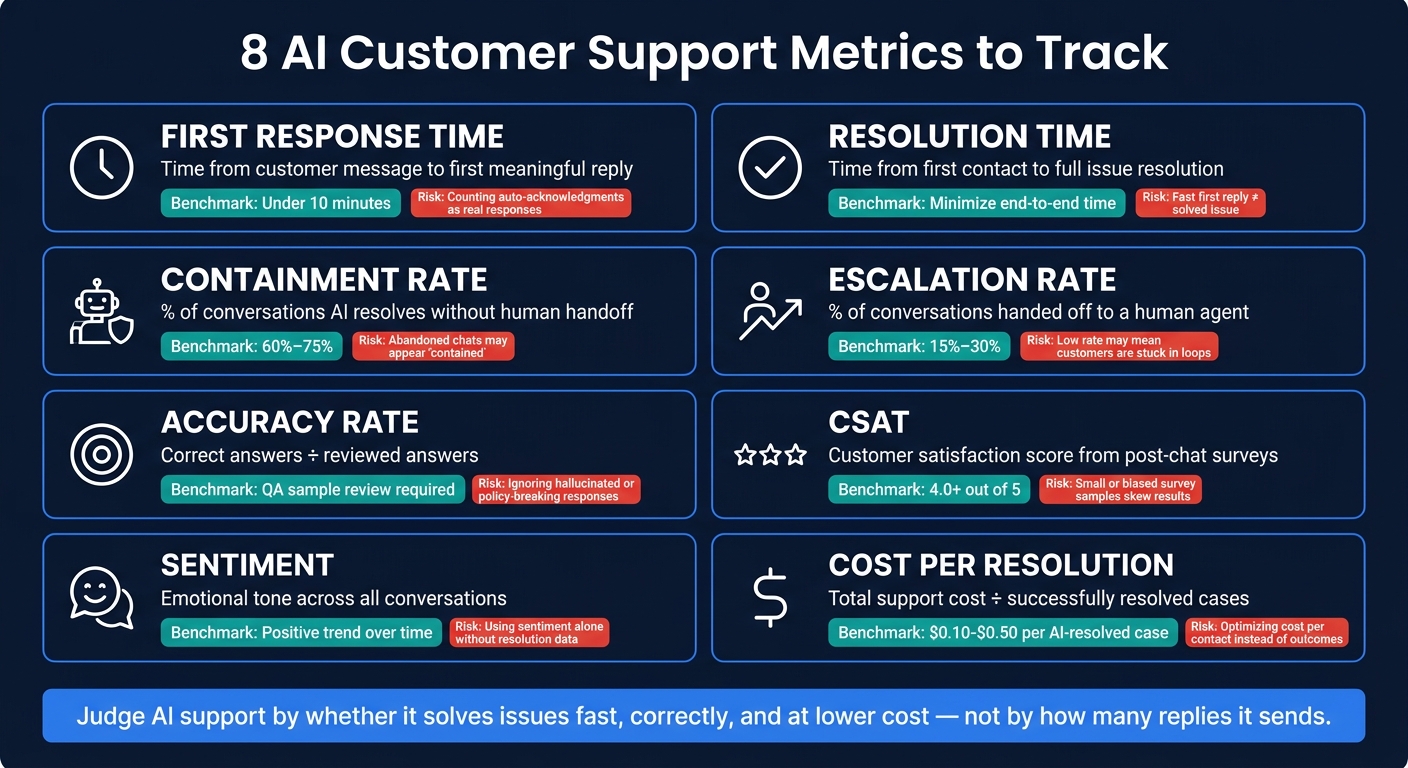
8 AI Customer Support Metrics: Benchmarks, Goals & Risk Flags
Now that the AI support implementation framework is in place, these are the eight metrics that tell you if AI support is fast, accurate, and cost-efficient. Each one answers a plain business question: Are customers getting help faster? Is AI solving issues on its own? Are answers correct? Is support getting cheaper without hurting results?
| Metric | Basic Measure | Why It Matters | Risk if Misread |
|---|---|---|---|
| First Response Time | Time from customer message to first meaningful reply | Responsiveness and queue health | Counting auto-acknowledgments as real responses |
| Resolution Time | Time from first contact to full resolution | End-to-end efficiency and workflow friction | Focusing on a fast reply that doesn't solve the issue |
| Containment Rate | Conversations resolved without human handoff ÷ total conversations | How much volume AI handles without handoff | Treating containment as success when issues remain unresolved |
| Escalation Rate | Escalated conversations ÷ total conversations | Where AI needs human support | Assuming all escalations are bad instead of necessary |
| Accuracy Rate | Correct answers ÷ reviewed answers | Reliability, compliance, and answer quality | Measuring only speed while ignoring incorrect or hallucinated responses |
| CSAT | Satisfied responses ÷ total survey responses | Customer-perceived quality | Relying on small or biased survey samples |
| Sentiment | Sentiment score or classified interaction signals | Friction and emotional tone | Using sentiment alone without whether the issue was solved |
| Cost per Resolution | Total support cost ÷ successfully resolved inquiries | Financial efficiency and ROI | Optimizing for cost per contact instead of completed outcomes |
The big thing here is context. Don’t read these numbers one by one. Speed, containment, and customer results don’t always move together. You can answer fast and still fail. You can contain more chats and still leave people annoyed.
Speed Metrics: First Response Time and Resolution Time
First response time should include only meaningful replies, not auto-acknowledgments. If a bot says “We got your message,” that’s not the same as actual help. And that gap matters: every minute of wait time reduces customer satisfaction by 2–3 points [3].
Resolution time looks at the full trip from first contact to solved issue. That’s the metric that shows whether support is working from start to finish. A quick first reply sounds good on paper, but it doesn’t mean much if the case keeps bouncing around [1].
Automation and Quality Metrics: Containment, Escalation, and Accuracy
Containment rate shows the share of conversations AI resolves without sending the customer to a human. A healthy target usually lands between 60% and 75% [3]. But this is one of those numbers that can fool you fast. If people give up because the bot is frustrating, those chats may still look “contained.” That’s why it helps to check containment alongside reopen rates to confirm the issue was actually solved [1] [3].
Escalation rate is the mirror image. A healthy handoff rate usually falls between 15% and 30% [1]. If the rate is higher, the AI may have gaps in its knowledge base. If it’s lower, that’s not always good news either. It can mean customers are getting stuck in loops instead of reaching a clean handoff. Some escalations should happen. The point isn’t to wipe them out. The point is to make sure they happen when they should.
Accuracy is what protects trust, compliance, and answer quality. One of the most useful ways to spot problems is to review a sample of AI conversations and look for wrong answers, stale information, or replies that break policy. That kind of review can catch issues before they hit a large number of customers.
Outcome Metrics: CSAT, Sentiment, and Cost per Resolution
CSAT, sentiment, and cost per resolution answer the part that speed and automation metrics can’t: Did the support work, and was it worth the money?
Post-chat CSAT surveys give customers a direct way to rate the experience. A score of 4.0 or higher on a 5-point scale is a fair baseline [3]. Still, sample size matters. If only a small or skewed group answers, the score can paint the wrong picture.
CSAT tells you how people scored the interaction. Sentiment tells you how the conversation felt across the full set of chats, not just survey responses. That makes sentiment useful, but only when you pair it with resolution data. A customer who sounds annoyed halfway through a chat but gets the issue fixed is very different from a customer who ends the session frustrated and walks away.
Cost per resolution shows whether the savings come from solved cases, not just cheaper contacts. That’s the key difference from cost per contact, which rewards volume whether anything got fixed or not. Cost per resolution counts only cases that were actually solved [1]. AI-handled resolutions usually cost between $0.10 and $0.50 per case [3].
Find Weak Points and Improve Results with ChatSpark
Tracking metrics only helps if you use the data to fix the bottleneck. ChatSpark helps support managers move from “something is wrong” to “here’s exactly what to fix” with dashboards and conversation reviews. Start with the metric that’s off target. Then trace it back to the intent, workflow, or language behind the drop.
Use Dashboards and Conversation Reviews to Find Bottlenecks
Top-line averages can hide trouble. A healthy overall CSAT score may cover up a single intent - like return policy or billing questions - where the AI keeps giving partial answers. Review resolution-time and CSAT outliers by intent and language to spot weak flows.
It also helps to compare results month over month. That makes it easier to see whether a knowledge base update improved performance or opened new gaps. Slow resolution times often point to missing knowledge, disconnected systems, or unclear escalation rules [1]. Conversation reviews inside ChatSpark let managers read the actual exchanges behind those outliers - across resolution time, CSAT, containment, and escalation - and verify which cause applies before changing anything.
Improve Metrics with Workflow Automation and Smarter Handoffs
Once you find the bottleneck, tighten the automation around it. The right level depends on the type of interaction. Order status questions often have an automation potential of 85%–95%, while billing and account issues usually land closer to 50%–65%.
Escalation logic needs close attention. The goal isn’t to remove handoffs. It’s to trigger them at the right moment. Sharpening escalation triggers for low-confidence responses, repeated failed answers, or billing disputes can improve containment and escalation rates without sending too many cases to agents. And when a handoff does happen, ChatSpark passes a full conversation summary to the agent, so the customer doesn’t have to repeat the issue [3].
Monitor Multilingual Performance Without Losing Quality
Use the same review process by language, not just by channel. U.S. businesses that support customers in Spanish, Mandarin, Portuguese, or other languages often track support metrics only in aggregate. That’s a blind spot.
Filter reports by language to spot content gaps and broken handoff rules. This makes it much easier to see where non-English conversations show weak containment, higher escalation rates, low CSAT, or negative sentiment - the same KPIs that matter across the rest of the framework [1].
Conclusion: Focus on the Metrics That Drive Better Support and Lower Costs
No single metric tells the whole story of AI support performance. Containment rate might look strong at first glance, but that number doesn't mean much unless customers actually got their issue resolved. You need to look at these metrics together to see if AI support is fast, accurate, and cost-efficient.
The best teams connect metrics to business outcomes. They break results down by intent, then dig into the outliers to find what's going wrong. That usually means reviewing conversations, spotting weak flows, and adjusting workflows or handoffs where needed. And when the AI shouldn't handle the issue, they make sure a clear human handoff is in place.
With dashboards and conversation reviews, ChatSpark gives support managers a practical way to track the metrics tied to speed, quality, and cost. The aim is steady gains in customer experience and a lower cost per resolution.
FAQs
Which AI support metric matters most?
The metric that matters most is resolution. It gets to the main point: did the AI fix the problem or not?
That’s why it makes sense to look past speed alone or whether the case stayed contained. Focus first on Automated Resolution Rate (ARR) and First Contact Resolution (FCR). When you pair those with CSAT and cost per resolution, you get the clearest picture of what your AI is doing for the business - and for the customer.
How often should I review these support metrics?
Use a layered review cadence.
Check daily for volume, escalation spikes, and classification accuracy. This helps you spot problems early, before they snowball.
Then review weekly for failed intents, unanswered questions, and low-rated conversations. That’s often where the pattern starts to show.
On a monthly basis, look at CSAT, sentiment, and agent performance. These metrics give you a clearer view of how the experience feels for customers and how the team is doing.
Finally, review quarterly metrics like ROI, cost per resolution, and staffing impact. This is where you step back and see what the program is doing for the business as a whole.
What is a good starting benchmark for AI containment?
A realistic starting benchmark for AI containment is usually 35% to 50% in the first six months.
Right out of the box, most setups land in the 20% to 40% range. That said, some industries can hit 70% to 90%.
The best move is to improve in cycles. Many organizations get to 60% to 75% after 90 days of training and knowledge base updates.
Don’t aim for 100%. Some issues still need human judgment, empathy, or careful handling of sensitive data.