
If you check your AI agent once a month, you may miss the early warning signs. I’d track a small set of weekly numbers: resolution rate, fallback rate, escalation rate, CSAT gap, latency, abandonment, reopen rate, automation rate, and cost per resolution.
Here’s the simple takeaway: one score should not stand alone. I’d use a weekly health score as a shortcut, then look at the few metrics behind it to find what changed. That helps me catch issues like rising fallback rate, lower answer accuracy, or more repeat contacts before they turn into higher support costs.
At a glance, the article says the weekly review should answer 3 questions:
- Is the AI solving issues?
- Are customers hitting friction?
- Is automation lowering cost without hurting CX?
The main metrics break into 3 groups:
- Experience: CSAT, sentiment, abandonment, reopen rate
- Team performance: resolution, containment, fallback, escalation, latency, answer coverage
- Business results: deflection value, automation rate, cost per resolution, repeat usage
A few numbers stand out:
- Fallback rate below 10% is a good target
- Fallback above 20% is a warning sign
- Escalation rate above 40% can point to trouble
- CSAT above 80% is a healthy mark
- AI response time under 2 seconds is a good benchmark
- Ungrounded answers can drive a 15%–20% error rate
I’d use the score for one thing: spot the change, find the cause, fix it that week. In this article, I’d expect a simple framework for scoring those signals and turning them into a short weekly review.
The Core Weekly Metrics That Define Agent Health
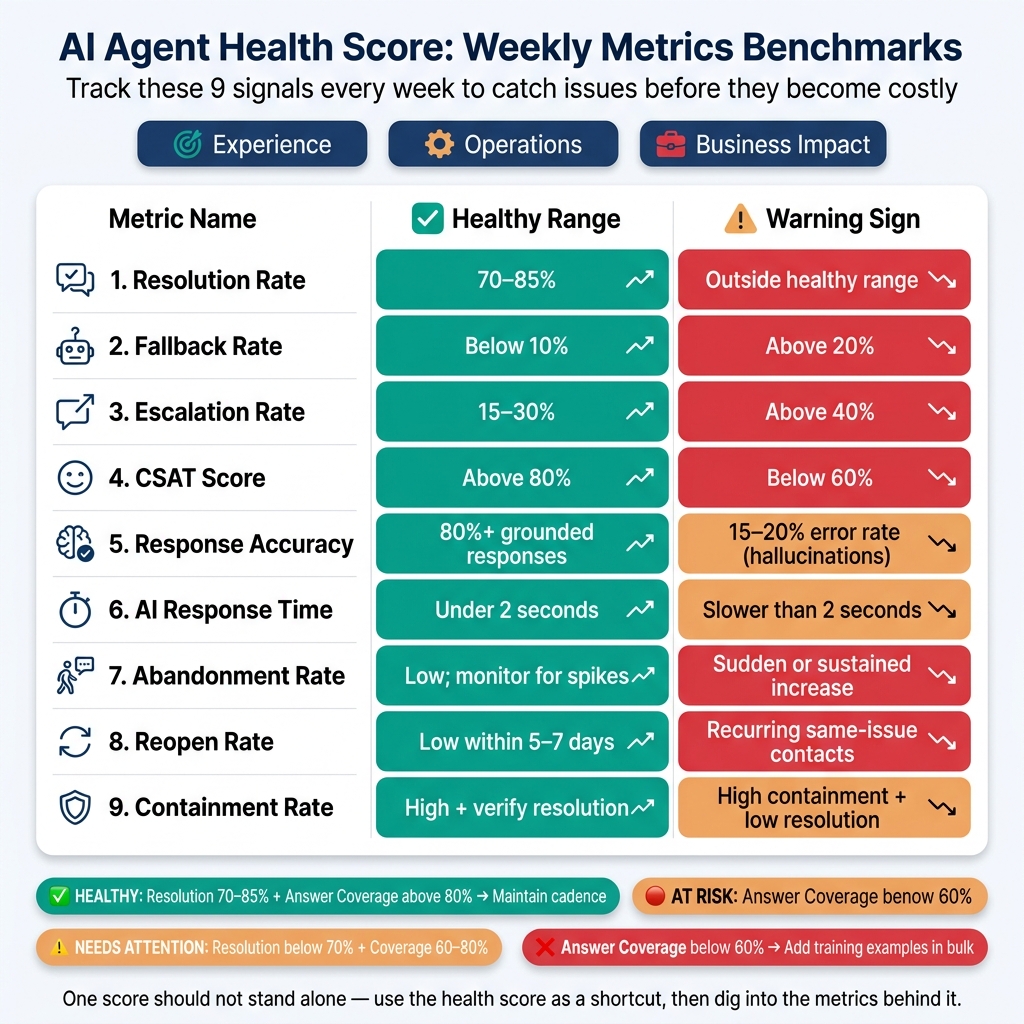
AI Agent Health Score: Weekly Metrics Benchmarks & Thresholds
To judge agent health week to week, focus on three groups of metrics: resolution, conversation friction, and reliability.
Resolution Rate, Containment Rate, and Escalation Volume
Resolution rate shows how often the AI fully solves the customer’s issue, not when the conversation falls back or the customer gives up.[2]
Containment rate sounds similar, but it measures something else. It tracks how many conversations the AI finished without sending the customer to a human agent. That matters, of course. But high containment can look better than it is if the customer’s issue never got fixed.
That’s why escalation volume is such a useful gut check. If escalations start going up, customers are choosing a person instead of sticking with the AI. At the same time, some escalations are normal. A healthy AI should still pass off harder cases.
Fallback Rate, Response Accuracy, and CSAT
Fallback rate measures how often the AI can’t give a relevant answer. In many teams, this is one of the first signs of trouble. It can point to customer satisfaction problems weeks before those issues show up in CSAT scores.[1]
Response accuracy checks whether the AI’s answer is correct and grounded in the right source. That’s a big deal. An answer can sound fine and still be wrong. Ungrounded AI answers can still produce a 15% to 20% error rate from hallucinations.[3] When that happens, customers come back again, contacts pile up, and trust starts to slip.
CSAT helps connect the dots. The most useful view isn’t only the raw CSAT number. It’s the delta between AI-handled cases and human-handled cases. That gap tells you much more about how the AI is doing.
Latency, Abandonment, and Reopen Rate
Response latency has a direct effect on CSAT. Nearly one-third of negative CSAT ratings are tied to slow response times rather than answer quality.[3] Use median latency, not average latency. A few very slow replies can throw off the average and hide what most customers actually experience.
Abandonment rate tracks conversations that end before the issue is resolved. If a customer goes quiet in the middle of a chat, that often points to frustration and a high risk of drop-off.[3] When abandonment jumps, look at where people are leaving the workflow.
Reopen rate exposes false resolutions. If the same issue comes back within 5 to 7 days, the first case wasn’t actually resolved.[4] This is the line between teams that measure true deflection and teams that measure containment and call it a win.
| Metric | Healthy Range | Warning Sign |
|---|---|---|
| Resolution Rate | 70–85% [2] | Outside the healthy range |
| Containment Rate | High, but verify resolution | High containment + low resolution |
| Fallback Rate | Below 10% [1] | Above 20% [1] |
| Escalation Rate | 15–30% [1] | Above 40% [1] |
| CSAT | Above 80% [1] | Below 60% [1] |
| Response Accuracy | 80%+ grounded responses [3] | 15–20% error rate [3] |
| AI Response Time | Under 2 seconds [3] | Slower than the healthy benchmark |
| Abandonment Rate | Low; monitor for spikes [3] | Sudden or sustained increase |
| Reopen Rate | Low within 5–7 days [4] | Recurring same-issue contacts |
These weekly signals feed the score. The next step is turning them into cost and customer impact.
How to Connect Agent Health to Cost, Efficiency, and Customer Outcomes
The earlier metrics tell you how the agent is doing. These metrics show what that means for the business.
Deflection Rate and Deflection Value in USD
Deflection rate is the share of conversations the AI resolves without sending the customer to a human. Deflection value turns that work into dollars.
Weekly savings = deflected conversations × cost per human resolution.
This is the money view of containment. But there’s a catch: a deflected case only counts if the issue was actually solved. If not, the savings on paper don’t hold up in practice.
That’s why it helps to look at deflection value next to cost per resolution. If automation goes up and support cost comes down, you’re on the right track. If automation goes up but unresolved cases pile up, the story changes fast.
Cost Per Resolution and Automation Rate
Cost per resolution = weekly support cost ÷ weekly resolved conversations.
When the AI handles more conversations without pushing up operating cost, this number falls. That’s usually a good sign. But if the AI takes on more volume and does a poor job, cost per resolution can move the other way.
Automation rate is the share of support volume fully handled by AI. Track it each week to see whether more automation is actually bringing down unit cost, not just shifting work around.
CSAT Delta, Sentiment, and Repeat Usage
Cost numbers matter only if the customer experience holds up.
CSAT delta shows whether satisfaction for AI-handled conversations is moving up or down.
Sentiment helps surface friction that CSAT may miss. A customer might finish a conversation without leaving a low score, yet still sound frustrated in the interaction.
Repeat usage shows whether customers trust the AI channel enough to come back. If repeat usage starts to slip, that can be an early sign that customers are avoiding the AI experience.
A Simple Weekly AI Agent Health Score Framework for CX Teams
Use a weekly scorecard to turn resolution, answer quality, and coverage into a 0–100 AI Agent Health Score. It gives your team a fast read on agent health without replacing the core metrics. Instead, those metrics become the inputs.
The point is simple: when the score drops, you can see whether the issue comes from the customer experience, day-to-day operations, or business impact.
Group Metrics Into Experience, Operations, and Business Impact
Start by sorting your metrics into three buckets:
| Bucket | Key Metrics | Purpose |
|---|---|---|
| Experience | CSAT, sentiment, abandonment rate, reopen rate | Measures how customers feel about each interaction |
| Operations | Resolution rate, containment rate, approved answer coverage, fallback rate, escalation rate, latency | Measures how well the agent handles requests without human help [2][1] |
| Business Impact | Deflection value, cost per resolution, automation rate, repeat usage | Measures cost efficiency and whether customers return to the AI channel |
This gives CX teams one weekly view of where the agent is doing well and where it starts to slip.
Set Weekly Thresholds and Score Bands
Once those buckets are in place, turn them into weekly score bands that tell the team when to step in.
| Score Band | Anchor Metric Signals | Status | What to Do |
|---|---|---|---|
| Healthy | Resolution rate: 70%–85%; approved answer coverage: above 80% | Healthy | Maintain cadence; review best-performing replies [2][1] |
| Needs Attention | Resolution rate: below 70%; approved answer coverage: 60%–80% | Needs Attention | Review the top 5 unanswered questions and update the knowledge base [2] |
| At Risk | Approved answer coverage: below 60% | At Risk | Add recent logs as training examples in bulk [2] |
The goal isn't just to lift the score. It's to cut failures, speed up resolution, and lower support cost.
Run a Weekly Review and Root-Cause Workflow
A score is only useful if it leads to action. Keep the weekly review under 30 minutes [5].
- Pull your weekly metrics report - gather the score inputs: resolution, CSAT, and conversation volume compared to the prior week [3].
- Check the "Top Unanswered Questions" report to spot the coverage gaps behind your fallback rate and see which bucket is dragging the score down [2].
- Review transcripts only for metrics that moved into Needs Attention or At Risk [1].
- Make targeted fixes mapped to the weak bucket - add 2–3 new training items from unanswered topics, update one help article, and retire one outdated reply [2][5].
- Measure the impact the next week with the 7-day training impact report to see whether the changes improved the score [3].
Conclusion: The Weekly Signals That Keep AI Support Healthy
These weekly metrics only help if you look at them every week. And they only matter if they lead to action.
When core metrics start to slip, check the unanswered-topics report and close the training gap before it gets worse. No need to repeat threshold numbers here - use the score bands and root-cause workflow from the framework above to see what needs attention first.
Once you know where the weak spots are, customer service automation can take some of the reporting work off your plate. ChatSpark's AI Operator can send weekly performance digests to Slack or WhatsApp. That means less manual reporting and better alignment across CX.
Small weekly fixes add up. Over time, they lead to better coverage and fewer blind spots. That’s the whole point of a health score: turn weekly signals into faster fixes.
The goal isn’t a perfect score. It’s early detection, faster fixes, and lower support cost.
FAQs
How do I calculate an AI Agent Health Score?
An AI Agent Health Score is a combined metric that brings together resolution rate, answer quality, and knowledge coverage to show how well an agent is doing overall.
To calculate it, roll those signals into a single score. Then keep an eye on resolution rate, fallback rate, CSAT, and knowledge base coverage so the score stays accurate and useful at a glance.
Which metrics matter most if my score drops?
If your AI Agent Health Score drops, start with the core metrics.
- Knowledge Coverage: If it falls below 70%, your agent likely has gaps in its training data. Check the Top Unanswered Questions and update the knowledge base.
- Fallback Rate: If it goes above 20%, the AI is often failing to understand user input or handle the request.
- AI Resolution Rate: If this number drops, the agent is solving fewer issues without human help.
It also helps to look at escalations. If they’re up, that often points to unresolved issues or friction in the automated workflow.
How often should CX teams review AI agent health?
CX teams should review AI agent health every week to keep performance steady and catch areas for improvement early.
A weekly check-in makes it easier to track things like fallback patterns, resolution rates, and unanswered questions. Then, on a quarterly basis, teams can step back and look at long-term ROI, deal with stubborn issues, and update their improvement roadmap.