If you can’t tie AI support to dollars, you don’t have an ROI case. I’d measure it with one formula: ROI (%) = (Net Benefits ÷ Total Costs) × 100, then back that up with baseline metrics, post-launch results, and a simple dashboard.
Here’s the short version:
- I’d pull 30 to 90 days of pre-launch data first
- I’d track cost per ticket, handle time, FCR, escalation rate, CSAT, agent use, and revenue tied to support
- I’d separate containment from true deflection
- I’d check results at 30, 90, and 180 days
- I’d count all costs, including setup, training, supervision, maintenance, and rework
- I’d count all gains, including lower support costs, time saved, after-hours coverage, and retention or upsell tied to service
A few numbers from the article show why this matters. Teams often see a 20 to 30-point gap between raw containment and repeat-contact-free deflection. And in the sample model, support costs drop from $12.50 per ticket to $4.50 at 90 days, with a 180-day target of $3.00.
What I like about this approach is that it stays simple: start with a clean baseline, compare the same KPIs after launch, turn those changes into dollar values, and keep reviewing the data each month so the math stays clean.
| What I’d measure | What I’d look for |
|---|---|
| Baseline costs | Current cost per ticket and labor load |
| AI results | Containment, deflection, resolution speed |
| Team impact | Hours saved, agent capacity, handoff quality |
| Customer impact | CSAT, reopen rate, churn, revenue tied to support |
| ROI math | Net benefits, total costs, payback period |
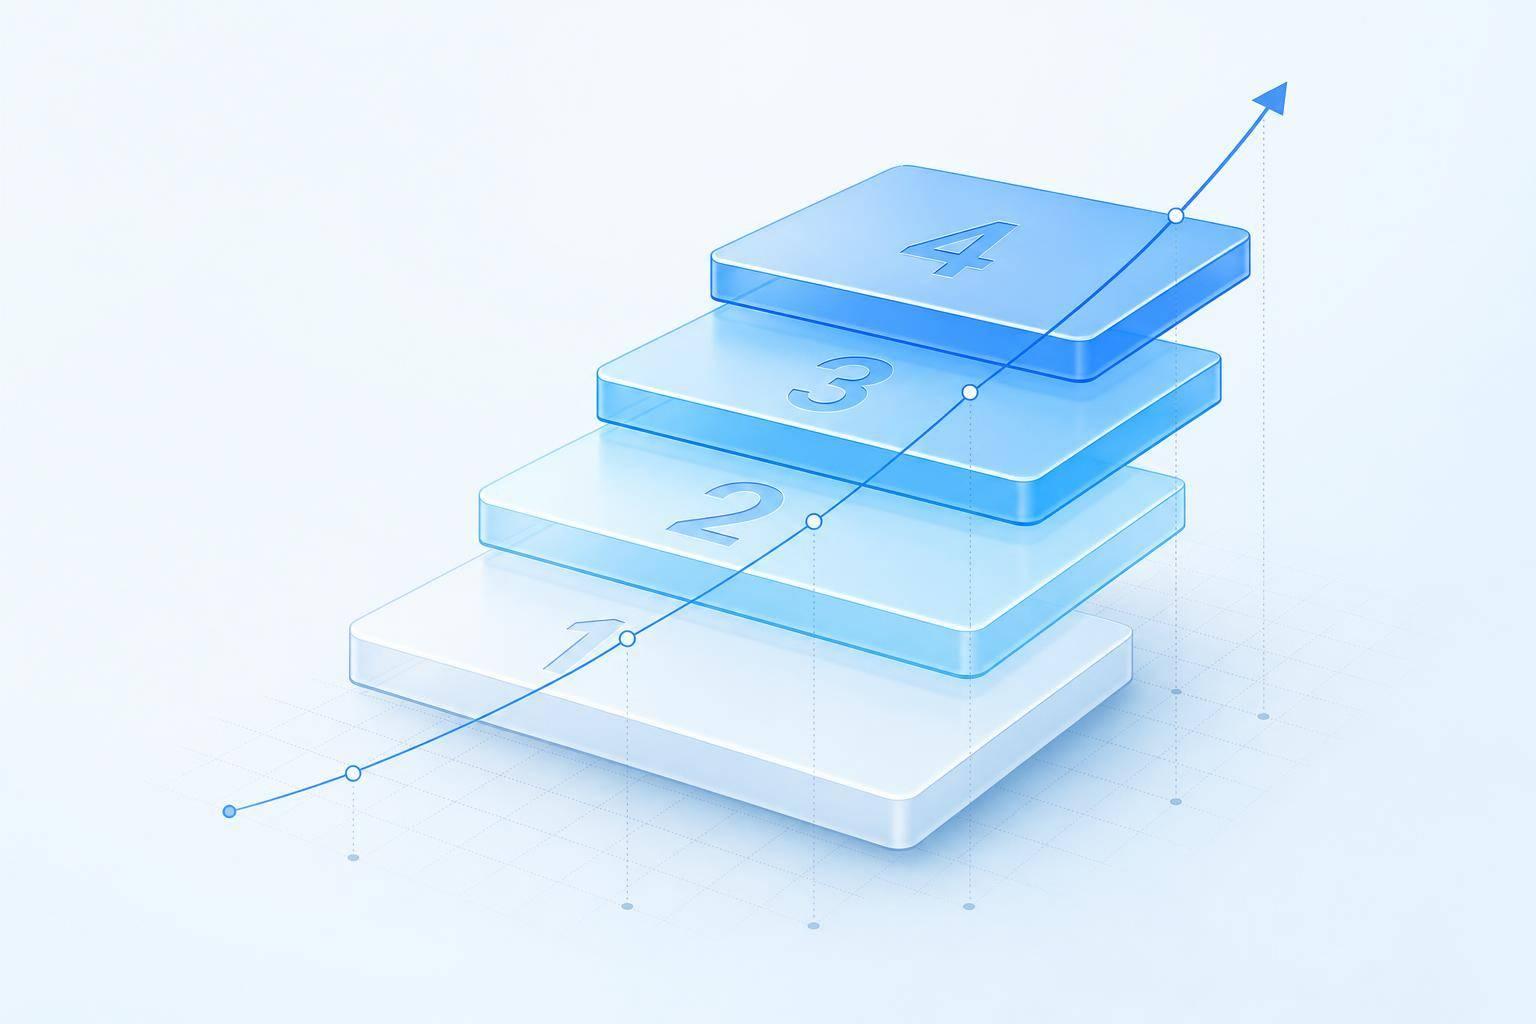
If I were putting this into practice, I’d treat the article as a simple four-step playbook: set the baseline, measure post-launch performance, convert results into dollars, and track ROI in a live dashboard.
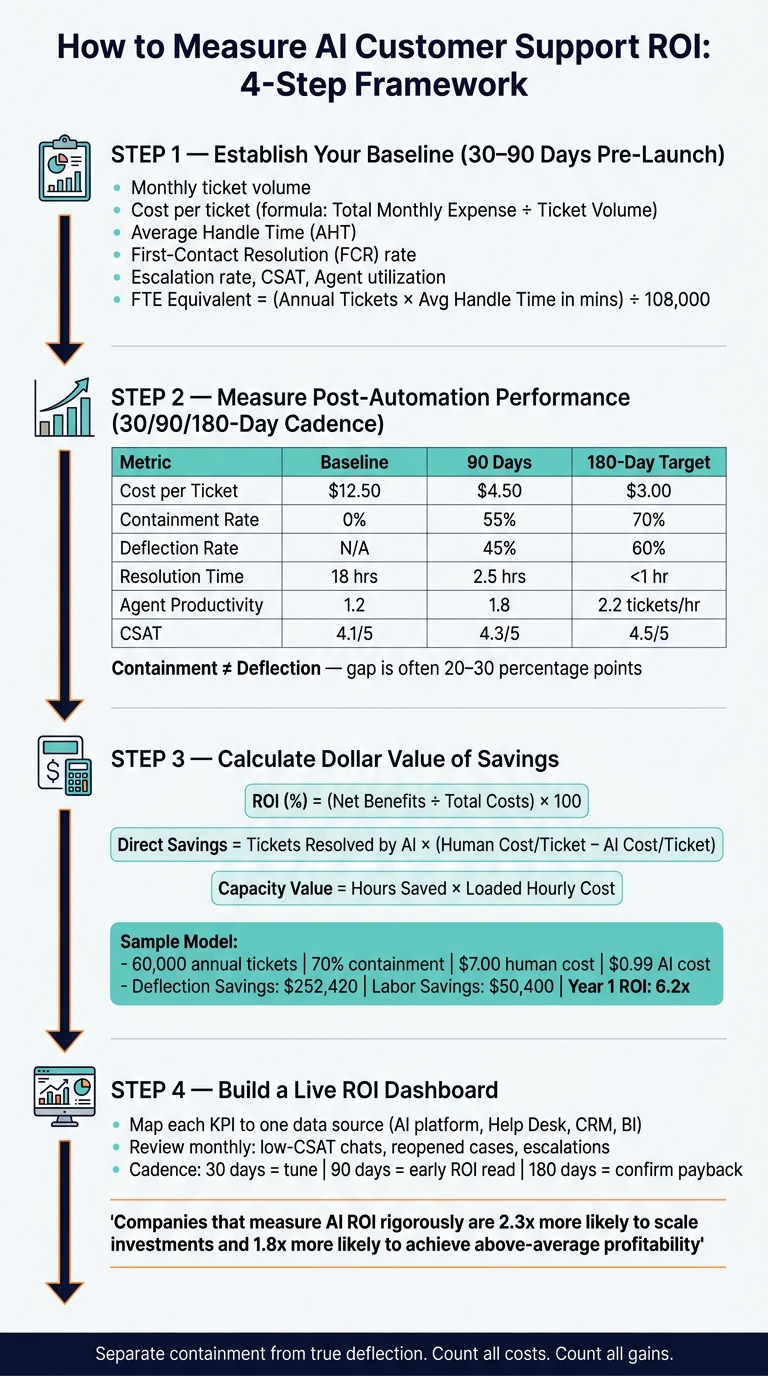
How to Measure AI Customer Support ROI: 4-Step Framework
Step 1: Establish Your Baseline Before You Automate
Before you launch anything, pull 30 to 90 days of operational data. That gives you a baseline based on normal workload patterns and seasonality, not a random high or low point [8][1].
The Baseline Support Metrics That Matter Most
You don't need to track everything. Focus on the numbers that affect cost, capacity, or customer experience.
| Metric | Why It Matters |
|---|---|
| Monthly ticket volume | Sets the scale of your automation opportunity |
| Cost per ticket | Your financial floor - the number AI needs to beat |
| Average handle time (AHT) | Shows where agent time is being spent |
| First-contact resolution (FCR) rate | Shows how often issues are solved without follow-up |
| Escalation rate | Shows the share of complex vs. routine work |
| CSAT | Shows the customer experience you're starting from |
| Agent utilization | Measures current productivity and capacity |
| Revenue affected by support interactions | Shows what's on the line if service is slow or unavailable |
If you want a tighter view of productivity, track agent utilization as total time spent on tickets ÷ total shift time [6].
It's also smart to track after-hours ticket volume on its own. That makes it easier to put a dollar value on the 24/7 coverage AI can offer.
Simple Formulas to Quantify Your Starting Point
Two formulas do most of the work.
Cost per Ticket = Total Monthly Support Operating Expense ÷ Monthly Ticket Volume
Use fully loaded monthly operating expense here: base salary, benefits, payroll taxes, management overhead, QA, training, and support software [6][7].
FTE Equivalent = (Annual Ticket Volume × Avg Handle Time in minutes) ÷ 108,000
This turns workload into FTEs and shows how much capacity automation can give back without adding headcount [5].
Where to Pull Baseline Data From
Pull your baseline from three places.
Your help desk analytics platform should be the main source for ticket volume, first response time, handle time, resolution rates, and escalation rates [8][2]. Pull enough history to account for seasonality, so you don't base decisions on a short-term spike or dip.
Your CRM holds the revenue side: customer lifetime value, churn rates, and revenue affected by support interactions [8][1]. This is where you can find revenue at risk - the value tied to customers who leave because support was slow or unavailable.
Your BI dashboards and finance records connect service metrics to operating costs [1][3]. If your help desk doesn't include loaded labor costs, get that data from HR or finance and combine it by hand.
Step 2: Measure Post-Automation Performance and Key ROI Drivers
Once your baseline is set, measure the same metrics after launch on a 30/90/180-day cadence. That means reviews at 30, 90, and 180 days: 30 days for tuning, 90 days for an early ROI read, and 180 days to confirm payback timing [7][11].
How to Measure Containment, Deflection, and Resolution Outcomes
Containment tracks sessions the AI handled without human escalation. But repeat-contact-free deflection is stricter. It only counts sessions that don’t reopen or trigger another support contact within 5 to 7 days [7][11]. That distinction matters.
A session can be contained and still not be resolved. For example, a customer might leave the chat before getting a clear answer.
Containment rate is often one of the first numbers teams check. Still, don’t treat it as the same thing as resolution.
Containment Rate = (AI-Resolved Sessions Without Human Escalation ÷ Total AI Sessions) × 100
In many teams, the gap between reported containment and repeat-contact-free deflection lands around 20 to 30 percentage points [7]. For a focused tier-1 use case, a 90-day containment rate of 55% to 70% is a sensible target [10].
Comparing Speed, Productivity, and Customer Experience After Launch
Now go back to the same core metrics from Step 1: cost per ticket, average handle time (AHT), resolution time, first-contact resolution (FCR) rate, agent productivity, and CSAT. Use the same formulas and same data sources. That keeps your before-and-after view clean and avoids the classic apples-to-oranges problem.
Recalculate first response time, AHT, resolution time, FCR, agent productivity, and CSAT across three groups:
- AI-handled sessions
- Human-handled sessions
- Handoff sessions
That split helps you see what the AI is doing on its own, where agents still do the heavy lifting, and where the handoff flow may be slowing things down.
Before-and-After KPI Comparison Table
The table below shows what a realistic before-and-after picture can look like for a support team [7][6][4][10].
| Metric | Baseline (Pre-AI) | 90 Days Post-Launch | 180-Day Target |
|---|---|---|---|
| Cost per Ticket | $12.50 | $4.50 | $3.00 |
| Containment Rate | 0% | 55% | 70% |
| Repeat-Contact-Free Deflection Rate | N/A | 45% | 60% |
| Resolution Time | 18 hours | 2.5 hours | < 1 hour |
| Agent Productivity | 1.2 tickets/hr | 1.8 tickets/hr | 2.2 tickets/hr |
| CSAT Score | 4.1/5 | 4.3/5 | 4.5/5 |
These shifts feed directly into the ROI math. In Step 3, use the changes in productivity, containment, and CSAT to work out savings and revenue impact.
Step 3: Calculate Cost Savings, Productivity Gains, and Revenue Impact
Now take the KPI shifts from Step 2 and turn them into dollars. This is the point where the ROI case stops feeling abstract and starts making sense to stakeholders.
How to Calculate Direct Savings From Automated Support Volume
Start with the baseline cost per ticket from Step 1. For ROI, use true deflection, not raw containment. Step 2 explains how to tell the difference.
Here’s the basic formula:
Direct Savings = Tickets Resolved by AI × (Human Cost per Ticket - AI Cost per Ticket)
If you also want to estimate labor savings from lower handle time, use this formula:
Annual Labor Savings = Automated Contacts per Year × Average Handle Time (hours) × Average Agent Hourly Cost [7]
Use fully loaded agent costs, not just salary. That means salary, benefits, payroll taxes, management overhead, and tools. In many teams, that lands around 1.5x to 2x base salary [2].
You should also set aside time for upkeep. Plan for a senior team member to spend 4 to 8 hours per week during the first three months tuning the AI and checking knowledge base accuracy [7].
One more thing: escalated conversations still cost human time and money. So when you estimate gross savings, subtract those labor costs [2]. That final number becomes the savings line in your ROI model.
How to Quantify Agent Capacity Gains and Customer Experience Value
For agent capacity, use:
Capacity Value = Hours Saved × Loaded Hourly Cost
AI-assisted agents can spend 20% less time on routine cases, which adds up to about four hours saved per week [3]. Multiply those hours by your loaded labor cost to estimate recaptured capacity.
Customer experience is a little trickier. CSAT, NPS, and CES are best treated as leading indicators unless you can tie them to churn. For example, if customers with CSAT scores below 3/5 churn at 2x the rate of satisfied customers, you can estimate retention value from any churn drop in that group after automation [7].
Keep that retention value in its own bucket. Otherwise, it’s easy to double-count it alongside labor savings [9].
If support also drives revenue, break out each revenue source on its own:
- Direct sales
- Lead capture
- Upsell and cross-sell
- Retention
Track those separately from labor savings so the math stays clean [2][9].
A Hypothetical ROI Example With Total Costs, Savings, and Payback Period
The table below shows how the inputs can roll up into annual savings and payback. Before you calculate net benefit, make sure your total cost line includes platform fees, setup, and ongoing supervision.
| Variable | Value |
|---|---|
| Monthly Ticket Volume | 5,000 |
| Annual Ticket Volume | 60,000 |
| Human Cost Per Resolution | $7.00 |
| AI Containment Rate | 70% |
| AI Cost Per Resolution | $0.99 |
| Deflection Savings | $252,420 [6] |
| Labor Savings | $50,400 [6] |
| Year 1 ROI | 6.2x [6] |
For actual ROI reporting, swap containment out for true deflection once you’ve confirmed tickets are not reopening within 72 hours to 7 days [7][1].
Companies that measure AI ROI with discipline are 2.3x more likely to scale their AI investments [2]. That means the measurement process isn’t just bookkeeping. It can shape how far the program goes.
Step 4: Build an Ongoing ROI Dashboard and Optimize for Better Returns
Once you've calculated ROI, don't treat it like a one-and-done exercise. Put it into a live dashboard and keep tracking it. ROI measurement should be ongoing, not a one-time calculation, so you can account for AI learning and performance gains over time [2][12].
Map Each KPI to the Right Data Source
Every metric in your ROI model needs a clear owner. If that part is fuzzy, teams end up reconciling numbers by hand, reviews slow down, and people start doubting the dashboard. The fix is simple: tie each KPI to one source so monthly reviews stay fast and auditable.
| Metric | Primary Source |
|---|---|
| Sessions, containment rate, automated resolutions | AI/chatbot platform reports [2][1] |
| Average handle time, cost per ticket, escalation rate | Help desk analytics [1][7] |
| 72-hour reopen and recontact rate | Help desk analytics, linked to chatbot session data [1][7] |
| Pipeline value, lead capture, retention, churn | CRM [2][1] |
| CSAT, NPS by interaction type | Help desk analytics and BI dashboard [2][1] |
| Cross-system trends for executive reporting | BI dashboard [2] |
Before scaling, link chatbot sessions to help desk tickets and CRM outcomes. If you don't, ROI reporting stays incomplete [1].
Set a Monthly and Quarterly Review Cadence
In the first 30 days, focus on direction. Is weekly containment improving? What share of queries can't the AI answer yet?
By 90 days, you can start measuring cost per resolved contact against your Step 1 baseline. By 180 days, churn patterns and customer lifetime value impact begin to show up [10].
Each month, review samples of:
- Low-CSAT automated conversations
- Reopened cases
- Escalations
That helps you spot knowledge gaps and broken handoffs. Also, track CSAT separately for AI-handled vs. human-handled tickets the whole time. That creates a simple feedback loop: measure, diagnose, fix, remeasure. The point isn't reporting for reporting's sake. The point is business improvement [1][10].
Conclusion: Tie Automation Outcomes to Measurable Business Results
The full ROI picture comes together when you connect each step: a documented baseline from Step 1, verified post-automation KPIs from Step 2, and dollar-based savings from Step 3. Step 4 keeps that picture current. Companies that measure AI ROI with this level of rigor are 2.3x more likely to scale their investments and 1.8x more likely to achieve above-average profitability [2].
The strongest business cases don't stop at reducing customer service costs. They tie automation outcomes directly to lower cost per ticket, faster resolution times, stronger agent efficiency, better CSAT, and measurable revenue impact. Use the dashboard to catch drift early and improve the automation paths that matter most.
FAQs
What counts as true deflection?
True deflection means AI fully resolves the customer’s issue without any human help, and the customer does not come back with the same problem within 48 hours.
This goes beyond simply not creating a human support ticket. The customer has to get the answer they need or finish the task without escalating the issue or asking again. If someone drops off in the middle of a chatbot conversation, that does not count.
How long does it take to show ROI?
Most AI customer support rollouts hit payback in three to six months. In some cases, teams start seeing results in as little as two weeks.
To measure ROI in a clear way, set a baseline before launch. Then track your metrics at 30, 60, and 90 days. Once performance levels out, switch to quarterly reporting.
Which costs are easiest to miss?
The easiest costs to miss are indirect operational and people-related expenses.
Subscription fees are just one part of the picture. You also need to count internal implementation time for configuration, integrations, and knowledge base setup. That work takes hours, and those hours cost money.
Then there’s the work that keeps everything running after launch: performance reviews, policy updates, model retraining, and QA oversight. On top of that, factor in the cost of agent turnover, recruitment, onboarding, and escalations.
In plain English: the sticker price is only part of what you pay.