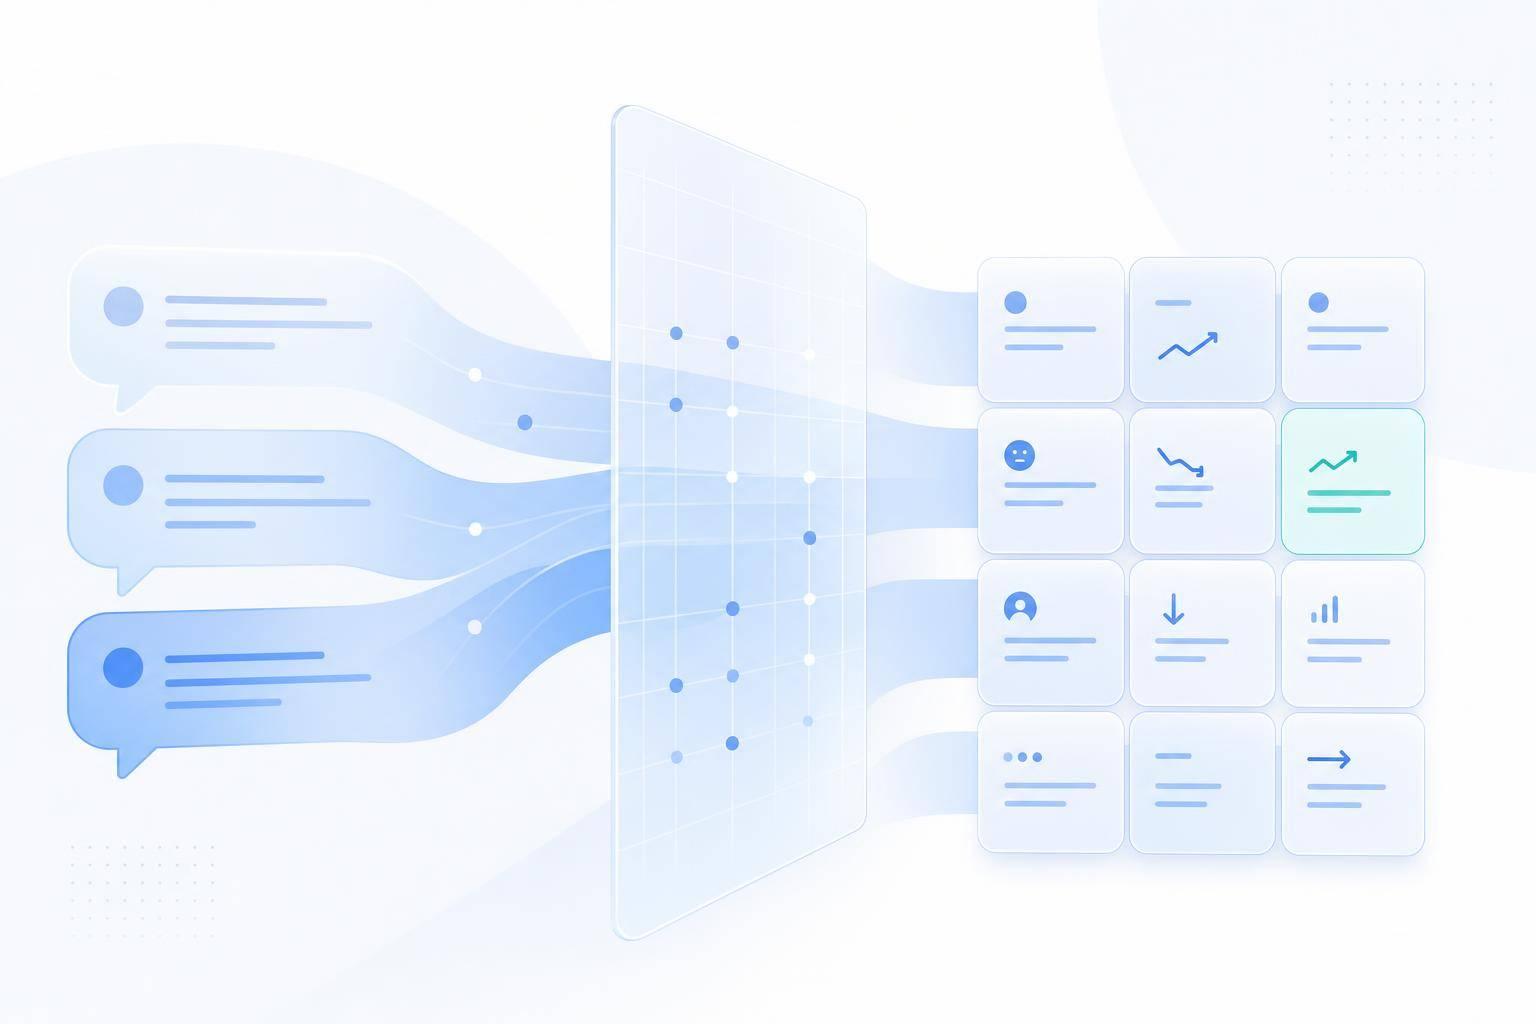
Your support chats already tell you what’s broken. If I review conversation data the right way, I can spot repeat issues, bot gaps, agent handoff problems, and high-effort journeys before they keep driving more contacts.
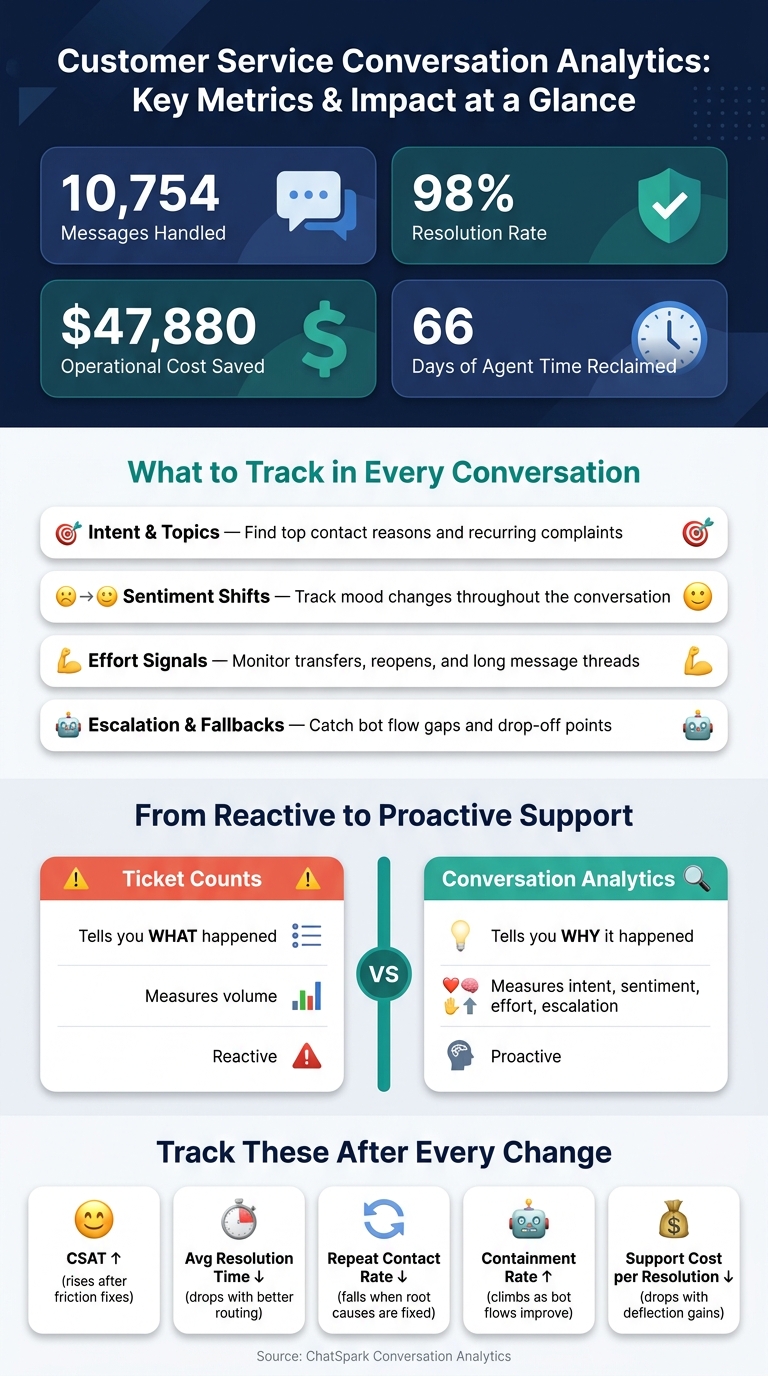
Here’s the short version: ticket counts tell me what happened; conversation analytics shows me why it happened. By tracking intent, sentiment shifts, effort signals, and escalation triggers, I can fix root causes, trim repeat contacts, improve self-service, and lower support cost per resolution. In one example from the article, a ChatSpark setup handled 10,754 messages, reached a 98% resolution rate, saved $47,880, and gave back 66 days of agent time.
If I want useful results fast, I focus on:
- Intent and topic patterns to find the top reasons people contact support
- Sentiment over time to see where chats get worse
- Effort signals like transfers, reopens, and long message threads
- Escalation and fallback data to catch bot flow weak points
- Clean transcript data with the same tags across chat, email, social, SMS, and voice
- QA scoring and alerts to connect issues to coaching, routing, content, or bot fixes
Bottom line: when I turn chat transcripts into structured data, I can move from reacting to support volume to fixing the problems that cause it.
Customer Service Conversation Analytics: Key Metrics & Impact at a Glance
What to Analyze in Customer Conversations
Look for the signals that show where things are breaking: messy processes, upset customers, and issues that never quite get solved. If you want to move past simple volume charts and get to the root cause, focus on four signals: intent, sentiment, effort, and escalation. Each one helps you figure out where the fix belongs - inside the knowledge base, the agent workflow, or the bot flow.
Intent, Topics, and Recurring Complaints
Intent detection groups conversations by what the customer needs, like billing, onboarding, or bugs. That makes it easier to see which issues drive the most volume and which complaints keep showing up outside formal tickets.
In most cases, a small group of intents drives most of the traffic. That’s useful because it shows where teams should look first. If the same topics come up again and again, there’s usually a gap somewhere in the product, the process, or the messaging. And that gap needs to be fixed at the source, not patched over one chat at a time.
Once you know what customers are trying to do, the next step is simple: measure how hard it was for them to get there.
Sentiment, Effort, and Resolution Quality
Sentiment analysis should show how the conversation changes over time, not just whether it ends on a positive or negative note. The tone shift matters. A customer who starts frustrated and ends neutral had one kind of experience. A customer who starts calm and ends angry had a very different one.
Effort metrics fill in the rest of the picture. High message counts, frequent transfers, frequent reopens, and cases marked resolved only after several failed attempts all point to the same problem: the customer had to work too hard to get an answer.
Track metrics like:
- FCR
- Bot-contained resolution rate
- Post-chat CSAT
These numbers help show whether resolution quality is getting better or slipping.
When effort stays high, it usually means one of two things: the automation isn’t doing its job, or the handoff to a human is falling apart.
Escalation Triggers and Bot Failure Patterns
Track fallback rate and the top unhandled phrases to spot gaps in bot coverage. That’s the obvious part. But don’t stop there.
Pay close attention to drop-off points too - the moments when users abandon the chat or type "AGENT NOW." Those are strong friction signals, and they deserve a close review. If people bail out at the same step over and over, something in the flow is getting in their way.
A simple weekly review of top unhandled topics can go a long way. Update the knowledge base based on what you find, and you can reduce repeat fallbacks over time. Unhandled phrases and abandonments usually point to the same set of fixes: new intents, better routing, or clearer fallback paths.
How to Collect and Structure Conversation Data
Once you know what you want to study, the next step is making data from each channel line up. Good analysis starts with clean, structured transcripts. If the data is scattered, mislabeled, or missing context, the insights usually fall apart.
Centralize Transcripts Across Chat, Email, Social, and Voice
Most support teams collect conversations from live chat, support email, social, SMS, and voice. But when those conversations live in different tools, it gets much harder to spot patterns across channels.
Pull them into one analysis-ready dataset. Include metadata like source, attribution, device, location, language, and customer status, such as plan tier, trial status, or cart value [2][3]. That setup helps make intent, sentiment, and QA analysis more dependable.
Clean, Tag, and Standardize Data Before Analysis
Raw transcripts usually come with extra clutter: boilerplate text, unclear speaker labels, and sensitive information. Before you run analysis, strip out the boilerplate, label speaker roles clearly, and mask sensitive data.
A consistent tag taxonomy keeps reporting clean. For example, use tags like intent:lead, topic:billing, outcome:resolved, and source:pricing [1]. Keep each conversation limited to 1–3 tags so reports stay focused [2]. Run a weekly tag audit to merge duplicates and retire tags that barely get used [2]. Auto-tagging can help too. If a message includes a trigger word like "refund", it can suggest topic:billing and cut down on manual labeling mistakes [2][3].
Use the same field set across every channel.
| Data Category | Recommended Fields/Tags | Purpose |
|---|---|---|
| Context | Source URL, UTM parameters, device/browser type, geo-location, local time, preferred language | Attribution and behavioral analysis [2][3] |
| Customer Status | Plan tier, trial status, cart value | Segmentation and prioritization [2][3] |
| Tag Taxonomy | intent:lead, topic:billing, outcome:resolved, source:pricing |
Categorization for reporting [1] |
Start timing at the first customer message. Stop only when the conversation is tagged outcome:resolved or outcome:escalated [1].
Methods and Dashboards That Turn Conversations Into Insights
Once your tags are set up, you can start using analytics to spot patterns in support behavior.
Use Sentiment Analysis, Intent Detection, and Topic Clustering
These methods help support leaders see what customers are asking for and where service starts to crack.
Sentiment analysis: Tracks changes in customer mood and flags urgent negative messages so teams can move on them fast [1].
Intent detection: Sorts conversations by contact reason and shows when one issue starts spiking [1].
Topic clustering: Groups related conversations by meaning so recurring gaps are easier to spot [1].
You should also set alerts when sentiment drops, wait times miss SLA targets, or a certain intent jumps [1].
Those signals make the next step clearer. They show support teams what to fix first instead of guessing.
Track Quality and Performance in QA Dashboards
After patterns start showing up, QA helps turn those patterns into action.
A QA dashboard gives supervisors a way to review service quality at scale. A good starting point is to sample about 10 chats per agent each week and score accuracy, tone, speed, and compliance on a 1–5 scale [1].
The dashboard shouldn't stop at chat reviews. It also needs to surface the signals that point to service issues and repeat friction.
| Metric | What It Tells You |
|---|---|
| 90th percentile response time | SLA pressure |
| Negative topic tags | Recurring friction topics |
| Containment rate | Bot self-service success |
| Fallback rate | Bot failure points |
| Accuracy, tone, speed, and compliance | Agent QA score |
Automated alerts should fire when 90th percentile response times go past SLA thresholds or when negative topic tags like billing-urgent spike [1]. That helps supervisors catch small problems early and connect them to the right next move: coaching, routing changes, content updates, or bot-flow fixes.
Apply ChatSpark Analytics Across Omnichannel Support
ChatSpark's analytics layer works across websites, Instagram, Facebook, WhatsApp, Telegram, and Slack. That gives support teams one place to view intent trends, friction points, and bot performance.
Fallback and containment rates are especially useful here. They show where bot flows are working and where they need another pass.
Those findings then feed into the workflow, coaching, and bot updates that come next.
Turn Insights Into Faster Resolution and Better CX
Fix Friction Points, Coach Agents, and Improve Bot Flows
Start with the areas that cause the most friction. Look at high-friction intents and failed bot paths, then decide what to fix next. Rank issues based on volume, sentiment, and escalation risk, using your current taxonomy to spot the patterns that create the most trouble.
Once you know the top issue, route it to the right fix: content, routing, coaching, or bot flow changes. If customers keep asking the same thing, rewrite the help content. If QA scores show weak spots, coach agents on accuracy, tone, speed, and compliance. If similar cases get different answers, standardize macros. If chats keep landing in the wrong queue, adjust routing logic. And if one intent keeps breaking bot containment, fix that bot flow first.
One ChatSpark deployment handled 10,754 messages, achieved a 98% resolution rate, saved $47,880 in operational costs, and reclaimed 66 days of agent time.
Measure Impact With CX and Cost Metrics
After each change goes live, track the same intent and QA trends for 2–4 weeks. Compare pre- and post-change results across CSAT, average resolution time, repeat contact rate, containment rate, and support cost per resolution. Weekly reviews help teams choose the next fix. Monthly reviews help surface bigger product or documentation gaps.
| Metric | What Improvement Looks Like |
|---|---|
| CSAT | Score rises after friction points are fixed |
| Average resolution time | Drops when routing and macros are improved |
| Repeat contact rate | Falls when root causes are fixed |
| Containment rate | Climbs as bot flows get better |
| Support cost per resolution | Drops as deflection and efficiency go up |
Teams that use conversation analytics to make changes - not just collect reports - tend to improve both CX and cost. Customers get faster, more accurate help. Support teams spend less to deliver it.
FAQs
How do I get started with conversation analytics?
Start by pulling chat transcripts and support messages into one system. Then get clear on what you want to improve.
Track a small set of baseline metrics:
- First Response Time
- Average Resolution Time
- CSAT
- Conversation volume
- Top intent tags
From there, keep your tagging system consistent. A messy taxonomy turns reporting into a headache fast.
Build a simple dashboard so you can spot patterns at a glance. Review a small sample of conversations on a regular basis to check accuracy and tone. And set alerts for spikes in response times or negative sentiment, so problems don't sit there unnoticed.
What data do I need to analyze support conversations well?
Track the metrics that show how your support flow is doing: first response time, resolution time, conversation volume, escalation rate, and task completion rate. These numbers help you measure efficiency and spot bottlenecks before they turn into bigger problems.
Then add context to those metrics. Use intent tags, source pages, device types, sentiment snapshots, CSAT, abandoned chats, and missed utterances to see where people get stuck. That extra detail can reveal friction points and show you where your AI’s knowledge base and documentation need work.
How often should I review chat analytics and make changes?
Use a layered review cadence to keep improving over time:
- Daily: watch real-time dashboards for alerts or sudden drops in CSAT.
- Weekly: review a sample of transcripts, check quality, and make small updates.
- Monthly: look at trends, adjust workflows, and refine the knowledge base.
- Quarterly: remove unused tags and retire outdated content.