Fragmented data is costing businesses billions. Teams waste time, make errors, and lose revenue because their tools don’t communicate. Employees spend 58% of their day on low-value tasks like searching for information or transferring data manually, while companies lose up to 30% of annual revenue due to inefficiencies. The problem gets worse with every new tool added, creating silos and increasing complexity.
Here’s the bottom line: fragmented data drains resources, slows decisions, and frustrates employees. The solution? Instead of replacing systems, businesses should focus on unifying access to existing tools. This approach reduces wasted time, improves decision-making, and cuts costs without disrupting workflows. AI-powered solutions like unified access layers and CoPilots make this possible, helping teams work smarter without overhauling their systems.
Key takeaways:
- $12.9M lost annually: Average cost of poor data quality for large companies.
- 58% of time wasted: Employees spend over half their day on "work about work."
- 40%-60% savings: Unified access reduces tool duplication and inefficiencies.
- Manual errors and delays: Fragmentation leads to costly mistakes and missed opportunities.
Unified access fixes the root issue by connecting tools in real-time, enabling better collaboration, faster decisions, and reduced costs - all without forcing teams to abandon their current systems.
What Fragmented Data Looks Like in Practice
Fragmentation is a daily challenge in team workflows. On average, companies juggle 101 apps [9], while mid-market firms rely on a median of 23 separate marketing platforms [13]. Each tool comes with its own login credentials, data formats, and update schedules. For instance, a single customer journey might involve seven different systems - LinkedIn, Google Analytics, HubSpot, webinar platforms, lead scoring tools, CRM, and billing software. None of these systems provide the full picture [13]. This disconnected setup leads to internal misalignments that ripple across teams.
Departmental Silos
When departments fail to align on data definitions, they often operate with conflicting realities. For example, Marketing might define "churn" as 90 days of inactivity, while Finance only counts canceled subscriptions [14]. These inconsistencies introduce serious operational risks.
Consider what happened to a Fortune 100 SaaS company in December 2025. Their AI CoPilot generated four different churn rates from disconnected systems: 4.7%, 11.2%, 18.3%, and 23.1%. Acting on the highest figure, executives approved an $8 million emergency retention program, which included incentives for customers who had merely downgraded plans. Three weeks later, Finance revealed the actual churn rate was just 4.7%. The misstep wasted resources and left truly at-risk customers unsupported [14].
"When every department owns a piece of the truth, no one owns the full story." - Jeff Winter, Author and Insights Leader [9]
This problem is widespread. 80% of organizations have departments working in silos, each managing data independently [10]. Marketing teams alone spend 12 hours per week reformatting spreadsheets and resolving conflicting data, inflating operational costs [13]. Sales and Marketing often clash over what qualifies as a "lead", and while 79% of customers expect seamless interactions across departments, 55% report feeling like they’re dealing with disconnected teams [9].
Legacy Systems and Duplicate Data
Fragmentation isn’t just about departmental silos; outdated systems add another layer of complexity. Legacy platforms that don’t integrate force employees to manually transfer data, consuming five to ten hours per week [11]. When official systems are cumbersome, teams often rely on makeshift solutions like spreadsheets - dubbed the "Excel Escape Hatch" [12]. This workaround only exacerbates data fragmentation.
A regional financial services firm faced this challenge. Its CRM, email platform, and loan processing software operated in isolation, leaving Marketing unable to track which campaigns drove loan applications. After adopting a unified data architecture, the firm saw a 29% boost in marketing-attributed revenue and cut manual data entry by 50% [11]. Before this overhaul, they were essentially operating blind, losing both opportunities and efficiency.
The problem runs deep. 60% of organizations struggle to manage data across 10 or more systems, and engineering teams often prioritize database speed over analytics, making cross-functional insights nearly impossible [16][12]. As a result, 55% of enterprise data remains "dark", meaning it’s collected but never used [9]. Alarmingly, 33% of business leaders admit they don’t trust their own data, a direct result of fragmentation that undermines strategic decisions [2].
The Real Cost: Time, Errors, and Missed Decisions
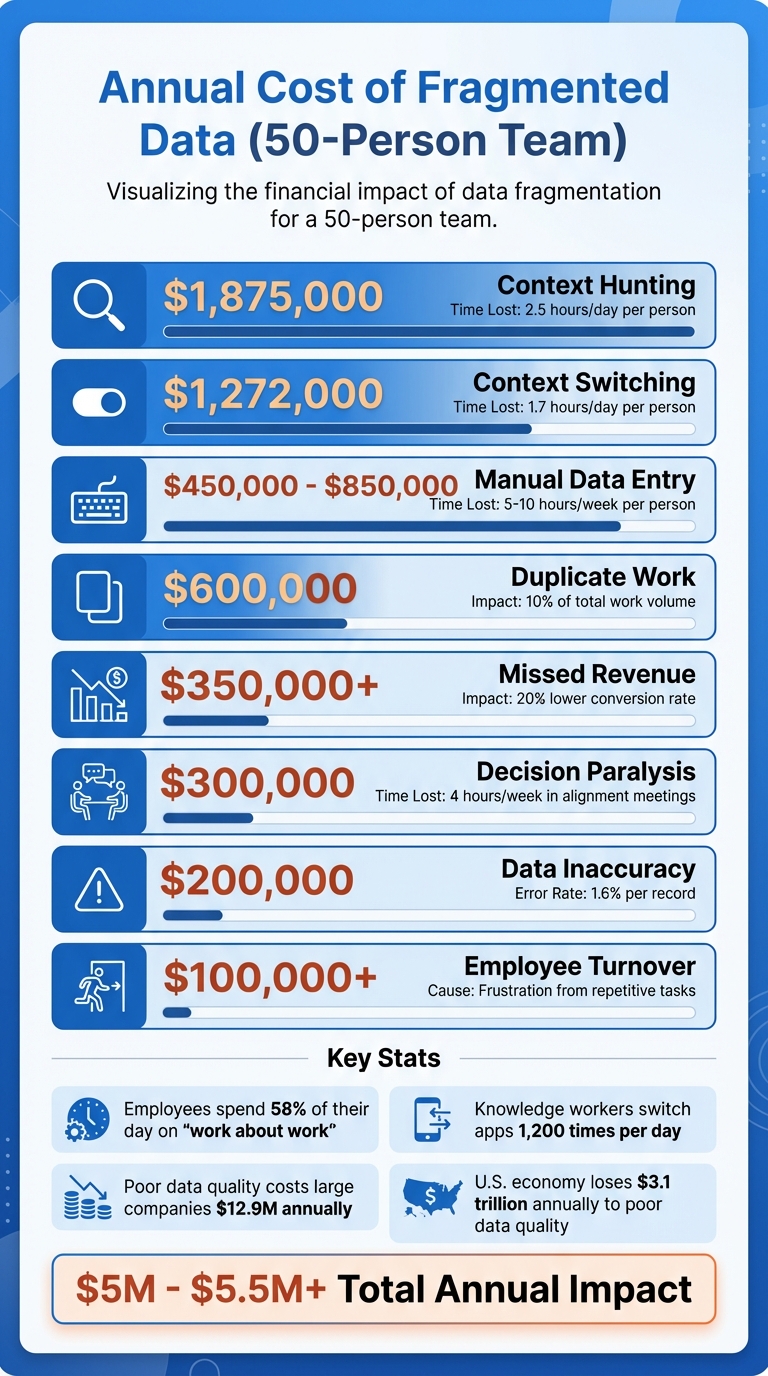
The True Cost of Fragmented Business Data: Annual Impact Breakdown
Fragmented data isn’t just a minor inconvenience - it’s a massive drain on resources, decision-making, and morale. For the average mid-sized business, disconnected systems result in losses exceeding $1.2 million per year [15]. Larger enterprises face even steeper losses, with poor data quality costing an average of $12.9 million annually [20]. These figures represent more than just numbers - they reflect wasted time, missed revenue opportunities, and inefficient use of labor.
Employees often find themselves bogged down in "work about work." Knowledge workers spend 58% of their day searching for information, reconciling conflicting data, and juggling shifting priorities [7]. On top of that, employees lose approximately 9 hours per week manually transferring data between systems that don’t integrate - a full workday spent acting as a "human API" [19]. For U.S. businesses, this inefficiency costs an average of $28,500 per employee annually [19]. Beyond inflating labor costs, these manual processes open the door to expensive errors.
The financial impact of data entry errors adds up quickly. With a 1.6% error rate per record [19], even small mistakes can spiral. The 1-10-100 Rule highlights the escalating costs: it costs $1 to verify data at the source, $10 to fix it in the system, and $100 if the error affects a customer - leading to potential churn or damage to your reputation [19]. Disconnected CRMs further lower conversion rates by up to 20%, while delays in campaign optimization due to fragmented data can cut monthly revenue growth by 2% to 3% [11][15]. These inefficiencies ripple across departments, often delaying key strategic decisions by as much as two weeks, as teams scramble to piece together data from multiple sources [13].
The mental toll is just as costly. On average, employees switch between applications 1,200 times per day [19]. Each switch disrupts focus, requiring about 23 minutes to fully recover and refocus on the original task [18]. This "Toggle Tax" doesn’t just erode productivity - it reduces cognitive capacity during heavy multitasking by 40% [19].
Cost Breakdown by Category
To understand the financial burden of fragmented data, here’s a breakdown of how these inefficiencies add up:
| Cost Category | Impact Metric | Estimated Annual Cost (50-Person Team) |
|---|---|---|
| Context Hunting | 2.5 hours/day per person [18] | $1,875,000 [18] |
| Context Switching | 1.7 hours/day per person [18] | $1,272,000 [18] |
| Manual Data Entry | 5–10 hours/week per person [11] | $450,000 – $850,000 [15] |
| Duplicate Work | 10% of total work volume [18] | $600,000 [18] |
| Missed Revenue | 20% lower conversion rate [15] | $350,000+ [15] |
| Decision Paralysis | 4 hours/week in alignment meetings [18] | $300,000 [18] |
| Data Inaccuracy | 1.6% error rate per record [19] | $200,000 [15] |
| Employee Turnover | Frustration from repetitive tasks [15] | $100,000+ [15] |
Altogether, the direct costs of fragmented data translate into a massive economic impact. Poor data quality drains $3.1 trillion annually from the U.S. economy [19]. At the company level, 56% of employees cite burnout caused by repetitive data tasks [19].
"There's a lot of automation that can happen that isn't a replacement of humans, but of mind-numbing behavior." - Stewart Butterfield, Co-Founder of Slack [19]
The issue goes beyond financial losses - it’s a challenge that affects both productivity and employee well-being.
Why Adding More Tools Makes Things Worse
When teams face challenges with fragmented data, the knee-jerk reaction is often to invest in yet another tool. Marketing needs better analytics? Add a new platform. Sales wants automation? Subscribe to another service. But instead of solving the problem, this approach often creates what operators call a "patchwork system" - a collection of disconnected tools held together by manual workarounds that drain time and energy.[22]
Small-to-medium businesses typically juggle 25–50 tools, while mid-market marketing teams rely on an average of 23 specialized platforms.[23][13] Each tool may address a specific issue, but without proper integration, they create "intelligence islands" - isolated pockets of data that fail to connect. This lack of connectivity prevents teams from gaining a unified view of the business. For instance, updating client information across multiple platforms often leads to version mismatches, while critical customer insights remain siloed and inaccessible.[24][23][17]
Adding tools also introduces a staggering amount of complexity. A stack of 20 tools generates 190 potential integration points, each requiring constant maintenance. Custom integrations alone can cost between $75,000 and $250,000 per project.[13][21] Middleware solutions like Zapier or Make might seem like a fix, but they come with monthly fees of $399 to $599, plus an additional 10 to 15 hours of upkeep every month.[21] For a small team of five, manually transferring data between disconnected tools can cost around $6,500 per month in lost productivity.[23] On top of that, up to 30% of SaaS spending is wasted on unused licenses and duplicate tools that fail to share data effectively.[21][6]
"Every disconnected system adds invisible drag to your business - like trying to run with sand in your shoes." - Business in a Box[22]
The problem only grows during mergers and acquisitions. When companies combine, they inherit incompatible data formats from legacy systems. Finance and operations teams often spend weeks reconciling these differences.[26][27] For example, 57% of banking executives report struggling to achieve a unified customer view due to entrenched data silos.[26] Additionally, institutional knowledge from the acquired company - buried in old emails, Slack threads, and CRMs - often becomes inaccessible, effectively erasing valuable organizational intelligence.[5]
Rather than solving fragmentation, adding more tools deepens it. Employees end up acting as "human glue", manually bridging the gaps between systems. Teams with overly complex tool stacks can spend up to 40% of their time on "tool management" instead of focusing on strategic work.[13] This inefficiency not only wastes resources but also undermines the ability to make informed, strategic decisions. Instead of boosting productivity, each additional tool becomes another layer of complexity, compounding the very problem it was supposed to solve.[4]
How Teams Try to Fix Fragmentation (And Why It Fails)
Manual Data Reconciliation
When systems don't communicate, skilled employees step in to manually transfer data between tools [7]. Unfortunately, this means your most capable team members - who should be focused on analyzing trends or closing sales - end up spending their time on tedious data reconciliation tasks. In fact, organizations lose up to 30% of their project management capacity to these manual processes [17].
The specifics vary by department. Marketing exports campaign performance to CSV files, Finance pulls revenue data from multiple platforms, and managers might spend hours aligning customer IDs and metrics in a master spreadsheet. Often, they sift through multiple versions of the same document, trying to figure out which one is up to date [2]. By the time the data is ready, it's already 24–48 hours old, making it less useful [3].
"Every hour spent reconciling files is time stolen from thinking." - Shaoli Paul, Product Marketing Manager, DecisionX [2]
This approach doesn't just waste time - it also introduces errors. Teams using disconnected tools experience a 34% increase in data inaccuracies [28]. When Finance reports one revenue figure and Sales reports another, trust in the data erodes, leading to endless debates over which numbers are correct [2]. On a larger scale, poor data quality costs businesses an average of $12.9 million each year [7].
The mental toll is just as damaging. Knowledge workers switch between different applications over 1,200 times a day, and it takes about 9.5 minutes to regain focus after each switch. This adds up to around four hours of lost productivity every week [32,34]. Manual reconciliation simply isn't sustainable - it treats people like software, ignoring human limits.
When manual methods fall short, teams often turn to informal processes that create even more inconsistencies.
Uncontrolled Data Sharing
In the absence of reliable systems, teams resort to informal data-sharing methods. They exchange information through Slack threads, email attachments, and private spreadsheets. This leads to "version conflicts", where multiple, inconsistent versions of the same data circulate without a clear source of truth [3]. For example, Sales might use one spreadsheet for customer data, Marketing another, and Finance yet another. Meetings often devolve into arguments over whose numbers are correct, and 33% of business leaders admit they don't trust the data they rely on for decisions [2].
This informal sharing also creates security risks and governance gaps. Sensitive customer data can end up in unsecured locations, making it nearly impossible for compliance teams to track who accessed what and when. For industries governed by regulations like SOX, HIPAA, or GDPR, this isn't just inefficient - it could lead to legal trouble [1].
The impact extends to customers as well. Without formal data-sharing processes, departments send mixed messages. For instance, Sales might offer a renewal deal to a customer with an unresolved support issue, or Marketing might send a promotion to someone who just canceled their account [8]. Over time, employees develop makeshift workarounds, relying on colleagues like "Sarah in Finance" or digging through Slack threads to find the "real" numbers [3]. These stopgap measures work - until key people leave or critical data gets lost. At that point, new team members are left scrambling, and the cycle of fragmentation continues, paving the way for more systemic failures.
Why Unified Access Beats Unified Systems
After addressing the issues with overly complex tool stacks, let’s explore an alternative that works with your current systems. Many businesses believe consolidating tools into a single "unified system" will solve data fragmentation and streamline operations. But there’s a major flaw in this thinking - teams are already comfortable with their specialized tools. Sales relies on their CRM, Finance on their ERP, and Marketing on their automation platform. Forcing everyone onto one system means months of migration headaches, hefty licensing costs, and a steep learning curve that can tank productivity [7].
Unified access offers a better solution without the chaos. Instead of replacing tools, it creates a shared data layer that connects them seamlessly. This layer ensures that when Sales updates a customer record, Finance can access the change immediately - no manual exports, no Slack follow-ups [7]. Teams get to keep the tools they know and trust while eliminating the silos that lead to inefficiencies.
The financial benefits are hard to ignore. Building custom integrations between disconnected systems can cost between $75,000 and $250,000 [21]. A unified access layer eliminates much of that expense by automatically handling authentication, authorization, and data synchronization [3]. Companies adopting this approach often see a 40–60% reduction in subscription costs, as they can retire duplicate tools previously needed to patch the gaps [21]. They also reclaim the 58% of the workday wasted on searching for information [7].
| Feature | Consolidated Systems Approach | Unified Access Layer |
|---|---|---|
| Implementation Time | Months to years | Minutes to days |
| Cost | High (Migration + Licensing) | Lower (Uses existing tools) |
| Team Impact | High disruption (Learning new tools) | Low disruption (Keep existing tools) |
| Data Logic | Rebuilt from scratch | Uses existing files/logic |
| Flexibility | Limited (Vendor lock-in) | High (Connects any app or spreadsheet) |
Speed is just as important as cost. Businesses with unified data access can make strategic decisions 3–5 times faster than those struggling with fragmented systems [21]. For example, when a customer support issue escalates, the team can instantly access a complete view - purchase history, open tickets, recent interactions - without hopping between multiple tools. This not only saves time but also improves the quality of decisions made on the spot. A unified access approach doesn't just solve current problems; it sets the stage for even more advanced solutions to reduce fragmentation further.
How AI CoPilots Fix Fragmentation Without System Replacement
<a href="https://chatspark.io/platform/copilot">ChatSpark CoPilot</a> addresses fragmentation by creating a unified access layer that seamlessly connects your team to the tools they already rely on. Instead of requiring a complete overhaul of systems like your CRM, ERP, or marketing automation platform, the CoPilot integrates with these systems in real time. It handles authentication and authorization automatically, ensuring that updates made in Sales are immediately visible to Finance - no need for manual exports or Slack messages [3].
This unified access approach keeps existing workflows intact while breaking down silos. By embedding directly into platforms like Slack and Salesforce, the CoPilot eliminates the need for employees to learn a new interface or constantly switch between tools. For example, in 2025, Salesforce introduced Slack-native Einstein bots for HR and IT support. Over three months, these bots processed 370,000 queries, saving employees 50,000 hours by reducing the time spent toggling between systems [29].
Another key advantage is the CoPilot's ability to retain institutional memory, unlike tools that "reset to zero" after every session. This capability is what some experts call "compound intelligence" [5]. Imagine a customer support agent needing a client's purchase history - the CoPilot can instantly pull data from the CRM, billing system, and support tickets, eliminating the hassle of searching through multiple systems or waiting for reports. This builds on the idea of unified access, delivering fast, cross-departmental insights without requiring a full system replacement.
"AI isn't failing. Access is. Data fragmentation blocks agents from real productivity." – Civic Team [3]
The financial benefits are just as compelling. Companies adopting unified AI platforms report 40% to 60% savings on subscription costs by retiring redundant tools that were used to bridge data gaps [21]. For instance, a consultant billing $150 per hour could recover $53,100 annually by cutting just 85 minutes of daily context switching [21].
AI CoPilots vs. Manual Workarounds
The contrast between manual processes and AI-driven solutions becomes clear when you look at the differences in time, accuracy, and cost:
| Feature | Manual Reconciliation | AI CoPilot Solutions |
|---|---|---|
| "Work About Work" | 58% of time spent on coordination and friction [7] | 50% time saved on core tasks [31] |
| Context Retention | No memory; starts from scratch [5] | Retains and builds knowledge across departments [5] |
| Error Rates | High risk of manual errors and compliance issues [34] | 15% fewer fines and material waste [34] |
| Onboarding Speed | Slow, with high digital debt for new hires [34] | 25%–30% faster onboarding [32][34] |
| Setup Time | Immediate but inefficient execution | Rapid deployment within days [21] |
| Data Freshness | Often outdated due to batch exports | Real-time updates via live data layers [7] |
Real-world examples highlight these advantages. In June 2024, Charlie Doubek, Global VP of Agentic AI Services at NTT DATA, conducted a five-day experiment involving 78 CoPilot requests. The result? He saved 390 minutes (6.5 hours) in a single workweek by using AI to summarize missed meetings, locate files on mobile devices, and rebook calendar slots [33]. Similarly, employees at Hargreaves Lansdown in 2025 saved 2 to 3 hours per week after adopting Microsoft 365 Copilot. Financial advisors, in particular, completed client documentation tasks four times faster than before [34].
Switching from manual workarounds to AI-powered solutions doesn’t just save time - it shifts the focus. Employees can dedicate their energy to strategic decisions and customer relationships, while the CoPilot takes care of repetitive, time-consuming tasks.
Final Analysis: Fix the Access Layer, Not the Systems
Fragmented business data is a productivity killer. The solution? Stop replacing systems - fix how you access them instead. Data fragmentation is no small issue, draining up to 30% of annual revenue globally [3]. The real problem isn’t your CRM, ERP, or marketing tools - it’s the lack of a unified layer to tie them all together.
By creating an access layer between users and existing tools, you can automate authentication, authorization, and data logic [3]. This eliminates the need for complex integrations - those costly connectors that run between $75,000 and $250,000 to build and often break during updates [7][21]. Instead of employees acting as "human APIs", manually transferring data between disconnected systems, a live data layer syncs everything in real time [30][7]. This instant synchronization lays the groundwork for measurable ROI.
Companies adopting unified AI platforms report saving 40% to 60% on subscription costs by cutting redundant tools [21]. For a 100-person business, the cost of switching between disconnected AI tools can range from $650,000 to $2.1 million annually [5]. Beyond cost savings, 77% of organizations with unified systems saw profit margins grow within a year, with an average increase of 8% [25].
"The bottleneck in your business is not data. It is reasoning." – Shaoli Paul, Product Marketing Manager, DecisionX [2]
But this isn’t just about saving money. Fixing the access layer creates what’s called "compound intelligence." Every interaction contributes to institutional memory, making your organization smarter over time instead of just faster in the moment [5]. Unlike fragmented systems that lose historical context with each session, a unified infrastructure ensures your team can make agile, informed decisions while preserving valuable insights for the future.
FAQs
How do I know if my company has fragmented business data?
Fragmented business data often shows up in several telltale ways. One major sign is data silos - when information is scattered across different systems, making it nearly impossible to get a complete, unified view. Another red flag is when teams report conflicting metrics, leading to confusion and inefficiencies.
If your business relies heavily on manual tools like spreadsheets to reconcile data, that's another indicator of fragmentation. This can slow down processes and increase the risk of errors. Additionally, delays in decision-making caused by time spent searching for or verifying data suggest a lack of streamlined access.
Catching these issues early can help ensure better data accuracy and smoother operations overall.
What’s the quickest way to estimate the cost of fragmented data for my team?
The fastest way to get a handle on the cost of fragmented data is by using a data integration calculator. This tool generates a customized report in less than a minute, showing the financial toll of data silos - like wasted payroll, avoidable errors, and operational slowdowns. With these insights, teams can pinpoint problem areas and take steps to reduce inefficiencies.
What’s the difference between unified access and replacing systems?
Unified access creates a centralized layer that links existing systems, enabling smooth data interaction without the need to modify the underlying infrastructure. This approach minimizes fragmentation and improves accessibility, all while avoiding the high expenses and risks associated with replacing entire systems.
On the other hand, replacing systems involves swapping out legacy tools for new platforms to break down silos. While this method can be effective, it often comes with steep costs, significant disruptions, and lengthy timelines. It usually requires extensive data migration efforts and may result in downtime during the transition.